Comments: (0)

MetaMap | 6000 km by Basurama, interview with Pablo Rey

Category: ⚐ EN+city+internet+Intervista+landscape+MetaMap+urbanism

Basurama is a forum for discussion and reflection on trash, waste, and reuse in all its formats and possible meanings. It was born in the Madrid School of Architecture (ETSAM) in 2001, and since then, has evolved and acquired new shapes.

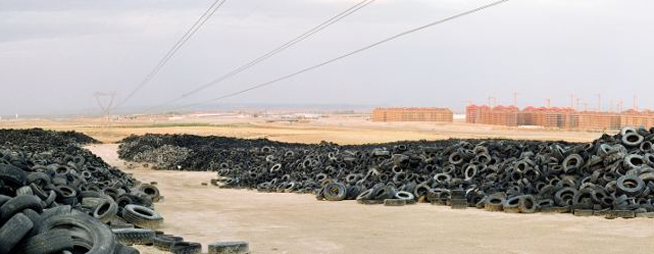
Tire Cemetery in Seseña (Toledo)

I interviewed Pablo Rey Mazón, member of Basurama, about 6000km, a project about the concept of trash applied to new constructions and land use, the metabolism of the city.


1. How did you get to the practice of mapping? What led you to the practice of mapping?

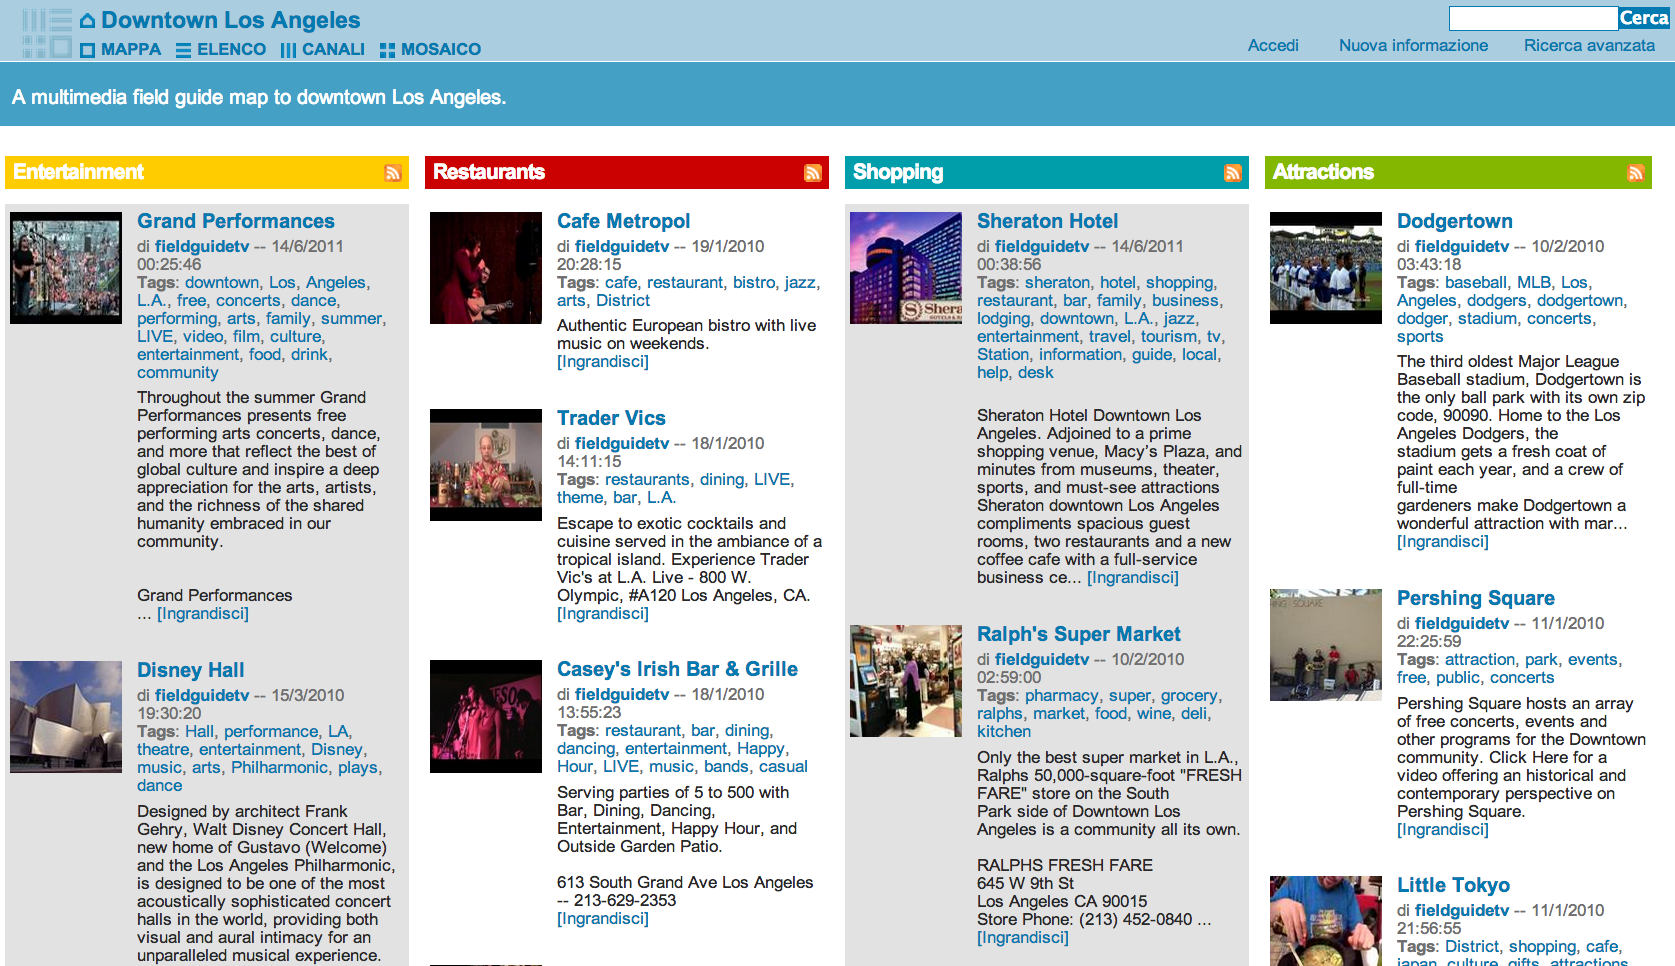
We use mapping, a geo-spatial representation of things, to understand and display complex situations. Maps have always been interesting to me: subway maps, the Callejero (the streetmap book from Madrid), and later in architecture school, I was using and producing maps quite often. Google Maps and Google Earth came later…. maps are one special part of all the data visualizations tools available.
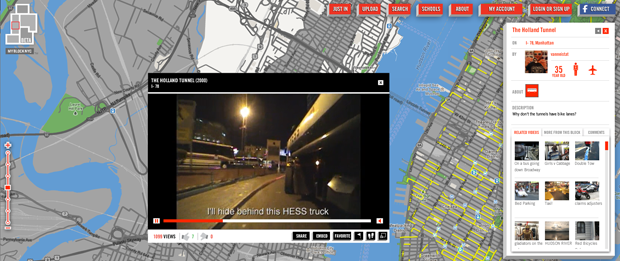
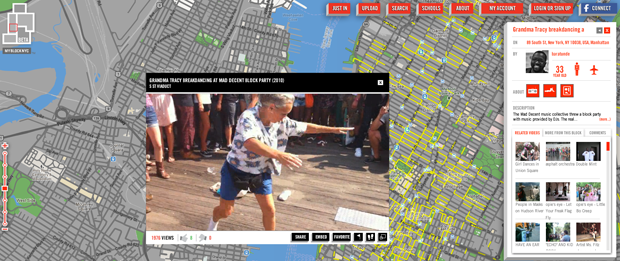
I have also participated in the development of meipi.org, an open source software for collective geo-location of information (texts, photos, videos, and audio) online, that we have used in many projects.

Interface of the map - Click to see original at Meipi

Interface of the map – Click to see original at Meipi

2. How did you choose the object of your mapping?

A map is a tool to decode certain information. Depending on the project, we would use one visualization or another. When we’re interested in the location of things, we use maps. In Basurama, we’ve used maps for many different projects apart from 6000km:

-Mapping urban metabolism landscapes (panorama photos) + real estate bubble: map, tactics in 6000km

-Mapping reusable waste in Ruhr (Germany) map 1map 2how to

Flow of waste in Mexico City

Exchange of objects map

In Ruhr, we used geo-located photos that we took, and a special instance of Meipi, to show the location of possible reusable waste. In spermola.org, we tried to give the opportunity to exchange an object by providing information about where the object was.

6000km started as an exhibition of 10 big format panorama photos from the Madrid outskirts: landfills, highways, scrapyards, and abandoned places. The project was part of the exhibition and was named Basurama Panorámica. It shows the public different places to envision the consequences of the urban expansion that was occurring at the time. Each photo had a short text attached to it, that served to contextualize and give basic information about it. We didn’t just want ‘awesome’ photos, we wanted to make people understand where and what those locations were. The exhibition had two related maps: urban growth and highways, apart from a location map of all the photographs. Displaying urban developments together with landfills and empty toll highways was the way to show the relation among all the urban metabolism related situations. Empty buildings made for speculation purposes where as waste made for scrapyards. That was 2006, 2 years before Lehman Brothers declared bankruptcy.

Later on, when we addressed this project in a country scale we studied and mapped all the situations in 6000km.org. “6.000 km” were the kilometers of highway that the government was planning to build until 2020.

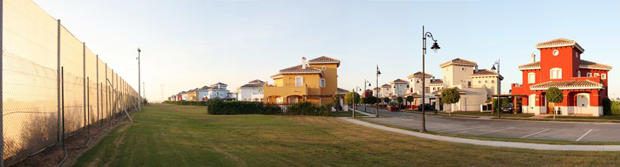
Mar Menor Golf Resort – Torre Pacheco, Murcia

3. In which way do you want this work to affect the people and society?

It is difficult to say how a particular project modifies the perception of a situation. In 2006 the real estate bubble was about to burst, but the public perception was saying “prices are never going to drop”, “we are the biggest growing economy in the world”, “keep building, buying, and selling, make money”. Mass media and politicians were basically denying the real estate bubble or saying that the process of land destruction was not sustainable. It was uncommon to address this topic. Nowadays, we can watch and read multiple news, documentaries, and exhibitions about a contemporary ruin or the economic crisis, but that was not the case back in 2006. It is impossible to measure that impact.

However, we were not alone in this task. There were other people talking about these issues as well. An example, El tsunami urbanizador español y mundial from the late Ramón Fernández Durán, or Ramón López de Lucio, that used our exhibition, among other things, to talk about the urban expansion and the backdrops of the star system architecture.  A year later, the Observatorio Metropolitano published a complete study of Madrid that delved deeply in the economical, social, and urban aspect of the situation. Madrid ¿La suma de todos? Globalización, territorio, desigualdad, and Derivart published casastristes.org.

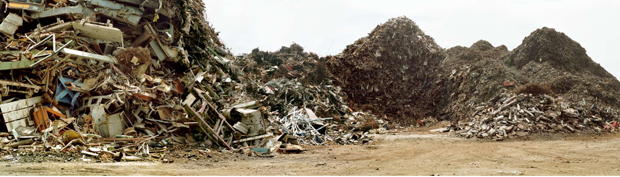
Junkyard Hermanos Lopez – Parla, Madrid

4. Which is the next phase of growth/development your research is undergoing?

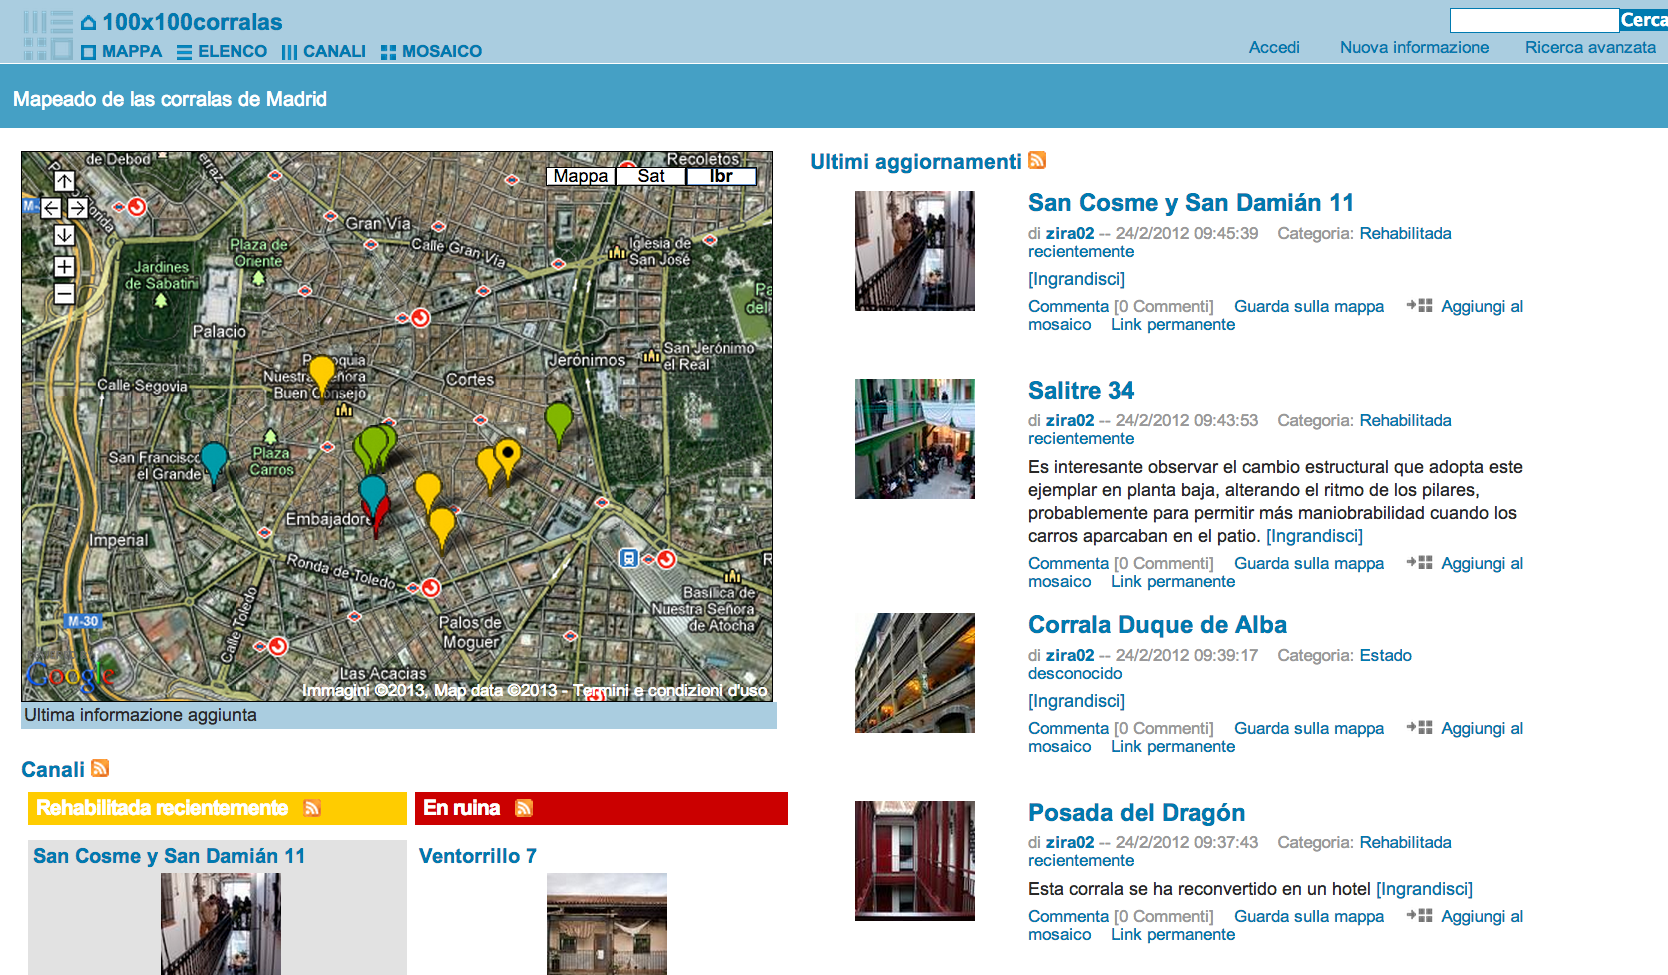
We went from the regional scale, Madrid conurbation, to a country scale, Spain, in 6.000km. We created an online map at meipi.org/6000km to display how our research evolved and to open both the information and participation to the public. We went to many of those places to document the sites. We have a full list available of all the studied locations, as we have realized before in Meipi, that maps are not the only way to show spatial information, and that lists can also be very useful.
Global scale: Since we’ve been travelling often to America with Basurama in the last years, we are now exploring ways to talk about these situations on a global scale in PAN AM, Panorama Americana.

Ruins in Vallecas, Madrid  - Click to view original map

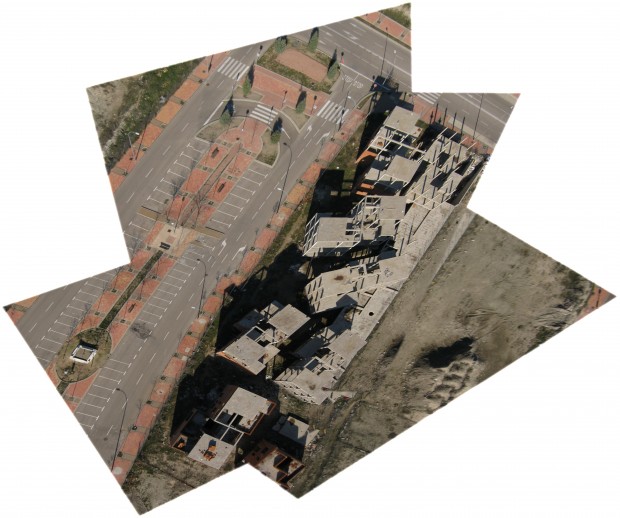
Ruins in Vallecas, Madrid – Click to view original map

Photos from the sky: We are also exploring new ways of exploring the territory with cheap balloon mapping technology. Our first results from Spain could be seen in the ruins at PAU del ensanche de Vallecas. Since last year we’ve been collaborating with the Public Laboratory in Boston, where we are mapping the evolution of an ash landfill in the suburbs of the city, Incinerator Landfill in Saugus, MA, USA, as well as mapping the waste locations from Cambridge, MA.
Civic maps: I am involved in a tool kit about civic mapping that will be released this year by the Center for Civic Media.

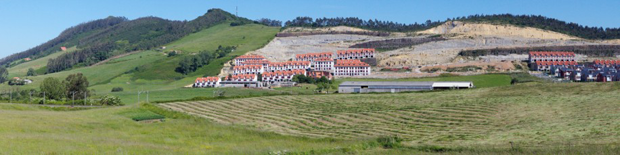
Alto del Cuco – Pielagos, Cantabria

5. What are your personal references for the theme of mapping (from ancient to contemporary ones)?

References come from many places: data visualization researchers like Edward Tufte; open hardware and cheap tools by Public Laboratory; Ushahidi and Crowdmap for collective info about maps; vojo.co for collective reporting from cheap phones; and online cartography tools like OpenStreetMap, where we are contributors and try to draw landfills and other non represented places in the map.

All the photos of the article are under a Creative Commons Attribution 3.0 Unported License and are made by Rubén Lorenzo Montero and Pablo Rey Mazón (Basurama). See legal notice.

Comments: (0)

MetaMap | Domenico Di Siena about Meipi

Category: ⚐ EN+⚐ IT+architecture+internet+Intervista+MetaMap+technologies+video

As part of the MetaMap series, I interviewed Domenico Di Siena, former curator of this blog, about a project he founded in 2007, Meipi, which is a collaborative space where users can upload information and content around a map.

Meipi.org […] is being used by communities, advocacy groups, journalists, artistic collectives, and urban planners to geo-tag information around a topic in a specific region. […]  Meipi is a community of developers, designers, and planners that have built and maintained Meipi.org since 2007. Since the software became open source in 2010, an entire community has contributed with its work and support.

Here you can find some examples of different visualizations of maps currently on the platform:

Multimedia field map of Dowtown Los Angeles


Map of “Corralas” in Madrid

Map of small shops in the Salamanca District

credits:

Meip-it Coordinators: Pablo Rey Mazón (Visiting Scientist, Center for Civic Media, MIT) and Alfonso Sánchez Uzábal (Developer and Researcher at Montera34)  Meipi developers, Pablo and Alfonso, both collaborate with the core developers from Meipi.com: Guillermo Álvaro Rey and Jorge Álvaro Rey from Lamboratory, Domenico Di Siena, @urbanohumano, and Francesco Cingoliani, @immaginoteca.


Comments: (0)

MetaMap | [im]possible living, rethinking the abandoned world

Category: ⚐ EN+city+internet+Intervista+MetaMap+technologies+urbanism

[im]possible living is a crowd-sourcing website dedicated to mapping and reactivating abandoned buildings around the world.

[im]possible living wants to be an enabler and a catalyst of the energies available in every place in the world that are not able to get through and give birth due to the abandonment market and, in general, to a new housing development model. It’s a very ambitious goal, but we truly believe in it and are investing everything in this dream!

I interviewed the two founders, Daniela Galvani and Andrea Sesta, about the project.

[im]possible living

1. How did you get to the practice of mapping? 

[im]possible living is born from our personal interest in abandoned buildings. At the time we understood that many individuals and associations were spreading energies to map the abandoned buildings in their area, but everyone was doing their own maps, thus losing the possibility of sharing results, experiences, and the best possible practices.

So we decided to create a global map of abandoned buildings via a web platform, where everyone could participate and contribute to a common goal and benefit from the experiences of other people.
Since the beginning of the project we have gone far beyond mapping tools. With the last release of our site, people can now reactivate an abandoned building and involve the community in the design concept for the new life of the building.

2. How is the users’ contribution managed? How does the platform work?

The website consists of a service through which users can surf and see the abandoned buildings that have been mapped around the world, which also shows their profile, containing a general description and some detailed information about the building (year of construction, years of abandonment, square meters, number of floors, etc.) To explore the mapped buildings click here.

The real heart of the service, however, is the reporting and collaboration features, through which users can upload new abandoned buildings and enrich existing records by adding photos and videos. If you would like to begin a map click here.

Users can also use a mobile app for the iPhone to instantly map abandoned buildings. Once launched, the application allows you to choose a photo from the Pictures archive, add essential information and automatically provide the geographic data associated with the location (street, city, etc.), allowing the user to change any incorrect information.

The last new part, which has launched recently, allows users to start a reactivation process. Once an abandoned building is mapped, a user can decide to become the reactivator of the place and [im]possible living provides him/her with a suit of services that helps collect the needs of the area, ideas for the future of the building, and in general, create a community that supports the reactivator in designing a concept for the new life of the building. The platform also tries to connect different kinds of users, everyone possibly involved in the renovation process: citizens, entrepreneurs, professionals, artists, real estate developers, etc.

[im]possible living map

[im]possible living map

These services are now online and we already have some projects running that you can contribute to or simply surf to get an idea:

Padiglione Conolly by RETESPAZZI
Sottopassaggio pedonale di Porta Vescovo by AGILE
Edificio 3 by workinco
Residenza by LANGYX
Villa Olga by BIELLAINMENTE
Ex Casa albergo per anziani by SIMONACOLUCCI
Ex-macello comunale by ASSBUENAONDA
Ex-Ospedale San Giacomo by ASSBUENAONDA
Masseria O’ Sentino by INDIEVIDUI
Stabile di uffici abbandonato by DANYGALVANI
Palazzo Cosentini by CARLONATOLI

3. What is the process you wanted to start with your work? What is the social aim you wanted to reach with your work?

In the last years we have witnessed the constant investment in new construction, leaving behind millions of old abandoned buildings. This process has led to the phenomenon of land consumption in most of the world, but the recent economic crisis stressed the problem even more, condemning the new constructions to remain vacant.

The solution to this problem is taking an altogether new approach: abandoned buildings are not liabilities but assets from which we should take the most possible advantage. [im]possible living tries to promote this new sustainability approach. Instead of building new structures over and over again, we can utilize what already exists. Having abandoned buildings in your city or in your neighborhoods is not only a waste, but it also means trouble, that, in a long term perspective, becomes costly for the public sector.

We are creating a platform available to all, which consists of the most complete database of abandoned buildings in the world. It is a virtual place that everyone can use and all can be shared and discussed, and where citizens can actually have an influence in shaping the future of the place they live in.

Many times the interests of construction companies, or even publicadministrations, are not consistent with the local environment of the area itself. This missing link between those sides can be discussed through the [im]possible living platform, in order to build mutual benefits for both sides. Through the website, entire communities can share their needs and ideas, and this could lead to a win-win situation for all parties involved.

Nowadays, real estate projects are handled behind closed doors and the problem is that often the local population is not involved in the design process. This implies, on the one hand, a mismatch between the purpose of the construction project and the real needs of the urban and social settlement. On the other hand, it takes additional time to complete due to the resistance from local communities, which often brings in legal involvement.

Our aim is to create a more efficient process to reuse abandoned structures, with a benefit for local communities that will be able to affect or even contribute projects on the online platform. A benefit for the public and private investors that would receive important inputs or even entire concepts developed by teams of reactivators and a benefit for the reactivator teams that would pursue their own projects with all the technological, professional, and financial support to fully accomplish their goal.

4. What is the next phase of development that your research will undergo?

We released the reactivation services a few months ago, so now our aim is to expand the community as much as possible and start as many reactivation projects as possible. This is very connected to making the available services better, making the actions easier, making the contributions from the community as simple as possible, and adding new features that can increase the sharing activity on the site.

Furthermore, we want to investigate the real bottleneck of reactivation processes: getting the project funded! In fact, the real problem when you talk about abandoned buildings is that, even with low-cost interventions, using them involves pricey investments. So our question is: How do we ease the investment process? How can we push for better projects and actually bring them to life? It’s complicated research, but it’s definitely what we want to focus on during the next year.

5. What are you personal references for the theme of mapping (from ancient to contemporary ones)?

Our point of view is very connected to recent technologies, in particular, web technologies. We consider the birth of web 2.0 and web 3.0 the beginning of a new era: the shift from static contents to dynamic ones, but more importantly, the participation and involvement of people in crowd projects, tools created for geo-localization, augmented reality, and much more.

This had a dramatic impact on the theme of mapping: for the first time in history, people from around the world could contribute to global mapping projects seamlessly, using services like Google Maps, Open Street Map, Wikimapia, History Pin, Ushaidi, Foursquare, and thousands of other services that are enabling users to map things in the world and share the information globally.

This process is generating a huge amount of data that, in most cases, is openly available to everyone via API systems (in computer science, an API is a way to access private databases, retrieve information, and build a new service using one or many different external data sources) For example, today I can use Google Maps API to obtain geographical information and then use Wikipedia to map monuments and historical places.

The potential of this revolution is very immense and has already started to affect our society in a significant way, but we still can’t entirely understand all the possibilities that will be generated in the upcoming decades.

Site: [im]possibleliving
If you would like to know more, visit their BlogFacebook and Twitter, or read their FAQ

Comments: (0)

MetaMap | MyBlockNYC, interview with Alex Kalman

Category: ⚐ EN+city+Intervista+MetaMap+video

Today we present a New York based video mapping project, MyBlockNYC. They define their project as:

MyBlockNYC.com is an interactive video mapping website that captures and presents personal video accounts of life and culture in New York City in order to create an intimate, evolving, and complete portrait of the great city. Users upload videos geographically, creating the first fully interactive video map of New York City.

The MyBlock Assignment is:

Share the moments you see on the wild streets of New York City. You can upload videos you already have on your cell phone and computer, or explore the city and capture what you see. Each video should be shot outdoors and take place on a single block.

I interviewed Alex Kalman, founder of the platform.

Here’s a few examples of videos on the platform:

The Holland Tunnel

Grandma Tracy breakdancing at Mad Decent block party

Jimmy Justice

This is the second post in the MetaMap series about mapping. You can follow the conversation on Twitter, Google+, Diaspora, or Facebook through the #metamap hashtag.

Comments: (2)

MetaMap | Urban Sensing by Accurat

Category: ⚐ EN+city+internet+Intervista+MetaMap+technologies+urbanism

Accurat is an information design agency based in Milan and New York, founded by Giorgia Lupi, Simone Quadri and Gabriele Rossi in 2011.

They define their work as the following:

We envision and identify new ways to structure information, revealing and addressing latent needs, desires and opportunities. Basing our methods on the design thinking approach, we specialize in providing our clients with consultancies, services, and products related to information design. Focusing on how information is transforming networks, cultures, contexts, and behaviors is an attempt to understand the future, a demonstration that it can be intercepted and designed.

I interviewed them about Big Data base maps and about their ongoing work in mapping: Urban Sensing.

Experiment of Tweet mapping in Milan during design week


1. How did you get to the practice of mapping? 

To us, mapping could be seen in a broader context as “structuring information”.

To start off, it’s not needed to say that information related issues are at the core of any design project that deal with cities, public services, society, and behaviors regardless of scale. Particularly, we have always been interested in urban related projects that deeply rely on information: contexts, analyzing data, designing analytical tools, and visual narratives that provide awareness and comprehension of changing urban dynamics.

In our past entrepreneurial experiences, at Interactiondesign-Lab, we experimented working between the intersection of information systems and urban dynamics within the design of the Plan of Services for the Municipality of Milan (developed between 2009 and 2010). We designed a plan not to be intended as a product or document, since it was developed as a continuous process of listening, monitoring, reporting, and crossing the needs and the offers in terms of services of the city.

We designed 2 tools at 2 different scales, the macro scale of the city and the micro scale of the neighborhood. These tools don’t define what services we plan to have, but they give directions on how to cross the demand and the possible answer in terms of services in a meaningful way. It was, in fact, an information design project.

2. In what way do you obtain and treat the data for your mapping?

A big mapping project we are currently working on and coordinating at Accurat is ✳UrbanSensing.

The ✳UrbanSensing project is a EU funded project which aims to design and develop a platform for extracting patterns of use and citizens’ concerns with city spaces, through robust analysis of User Generated Content (UGC) shared by city users over social networks and digital media. The platform will allow the user to analyze citizen’s perceptions related to specific geographic areas and understand how population reacts to new urban policies within participatory mechanisms.

Novel digital and telecommunication technologies can be deployed to integrate data-sharing platforms within the spatial dynamics of the city. If properly analyzed, geo-tagged and User Generated Content (UGC) coming from Twitter, Facebook, Foursquare, or Flickr can be useful in the creation of meaningful, real time indicators of people’s perceived and communicated urban experiences. Through natural language and network analysis, it is possible to identify the nested micro-narratives that shape the behavioral and semantic background of a place and to extract specific urban indicators.

Our assumption is that by conducting an analysis of datasets based on text extracted from UGC we can recognize multiple stories, as they emerge, overlap and influence each other, unfolding from city users’ mental representations and spatial experiences of city spaces. In fact, by providing tangible, visible references, the spaces of actual buildings and cities participate in constructing the meaning of the speech that articulates itself within them and as conversations unfold within particular architectural settings, they build up increasingly dense webs of shared understanding grounded -at least in part- on the points of reference that these settings afford.

Thus, within ✳UrbanSensing we are mainly gathering and analyzing geo-localized social media data (Twitter, Foursquare, Instagram, and Flickr); and such data will be properly integrated and compared with more traditional sources of urban information (socio-demographic territorial data, real-estate indicators, and environmental data) to produce dynamic and evolving images of the city as used and perceived by its’ citizens and temporary users.

3. What is the application of open source/social network-based mapping you are interested in the most?

If properly analyzed, integrated, and interpreted, Social Media data can help stakeholders at the urban scale to “forward-looking” innovation strategies based on a thorough analysis of people’s contexts, interests, and needs.

Among the possible urban topics this data could partially answer to, we will narrow them to the following particular issues:

  • Rapidly intercepting emerging urban dynamics, such as gentrification processes and precise areas’ evolution through time (for identifying trends in areas’ related phenomena, in the exact moments they’re originated, with the possibility to add more dynamic parameters to those used by the real estate market);
  • Understanding which are the factors (e.g. morphological aspect, aesthetic quality, public service availability and density, infrastructure granularity, cultural scene, and commercial service) that attract people in particular places (areas, neighborhoods), and how this evolves through time;
  • Understanding which kind of people (language / on-line influence / demographics) are in specific areas at particular moments;
  • Highlighting patterns of movement throughout  the city (from which places people in an area come from? where are they going? are they residents, visitors, or ordinary city users?);
  • Interrogating data about a particular topic (e.g. brand name, event name) or about a selected theme (e.g. cultural phenomena, cutting-edge topics) to see how things evolve spatially and temporarily.

All this, to provide a better understanding of an areas’ related phenomena and evolution, to redefine actual districts’ fixed boundaries and to see where public services, policy’s infrastructures, design interventions, or activities could be better located, and to try and build models to predict near-future evolution;

Experiment of Tweet mapping in New York


4. What is the next phase of development that your research is undergoing?

One of the forthcoming steps of our project is to gain a deeper understanding of:

  • How such data sources could be interpreted (in terms of sharing behaviors and motivations) to get actual and consistent insights;
  • Which are the real limits of such data in terms of research (e.g. demographic, digital divide, economic, location-related);
  • How to overlap and integrate such data sources with more traditional layers of territorial information (e.g. socio-demographic data, income data, rental costs, ethnic data, and environmental ones such as pollution and sanitary inspections, etc.) to finally display extreme high-resolution views and interpretations of territorial related dynamics.
  • How unexpected patterns and meaningful questions could emerge from data themselves. 

In fact, UGC differs from conventionally produced geographic information in several aspects. The source of the information, the technologies for acquiring it, the methods and techniques for working with it, and the social processes that mediate its creation and impact. Traditionally, geographic information has been produced by experts and institutions, therefore, certain types of information have been privileged and other types ignored, and even marginalized. UGC’s represent a powerful shift in sources, content, characteristics, modes of data production, mining, sharing, dissemination, and use. Therefore, a wide set of meaningful questions (that have been partly investigated for “conventional” geographical information) need now to be re-investigated, and a framework on how to use these information still has to be built.

In parallel, we are designing and developing the technological architecture and the actual interface allowing us (and lately, stakeholders) to perform specific queries and produce such dynamic maps in a very visual and intuitive way.

5.  What are you personal references for the theme of mapping (from ancient to contemporary ones)?

We would here focus on emerging critical practices that propose new models to describe the city that stresses the collaborative and constructionist dynamics of the mapping process.

The underlying idea of this approach considers the geographic, urban experience through a network of multiple fragmented temporary data and information generated by human-place interactions and collaborative dynamics. Based on these theoretical premises, several experimental GIS-based applications focusing on cartography emerging from users’ perceptions and activities have been produced.

As Zook & Graham noticed, traditional methods used to register users’ perceptions and activities about the cities and its fruition – like surveys and ethnographic reports – seem to be inadequate to meet the need of information of contemporary society both because they require a considerable amount of resources (in terms of time and money) and because they do not consider the temporal dimension.

Mapping projects based on UGC have been therefore conducted both by research institutions (e.g. CASA at University College London, SIDL Lab at Columbia University, Senseable City Lab at Massachusetts Institute of Technology, Urban Age at London School of Economics) and independent scholars and design firms (e.g. Christian Nold, Stamen Design) with the aim of creating new ways to observe and depict specific subjective and objective processes taking place in cities.

Senseable City Lab explored mapping systems based on UGC on several projects like World’s Eyes and Obama One People.

Current City, a European foundation committed to address long-standing city management problems in unconventional ways, explored the potential of urban mapping based on real-time data streams on users’ location coming from telco providers.

Christian Nold’s work focused on in-depth research of technological tools in order to unravel their social and political layers, and on building socially constructive, bottom-up devices, that take the form of practical tools such as in the Bio Mapping project.

Bio Mapping is a research project based on biometric sensors that can be worn by users provided with a GPS device able to trace their paths through the city, and that register specific parameters (e.g. emotional status in a specific place or situation) and publish them as user generated content on specific emotional maps. This project explores tools that allow people to selectively share and interpret their own bio data. Within this framework, Nold investigates how the perceptions of a community in an environment can change when they become aware of their own intimate emotional status.

Some other recent GIS projects focused on the idea of building open tool-kits that could be used by the community of students and practitioners of urban design, planning, and management. The Centre for Advanced Spatial Analysis at UCL created MapTube as a free resource for viewing, sharing, mixing, and mashing maps online and the NeISS project (National e-Infrastructure for Social Simulation) provides a platform to meet the demand for powerful simulation tools by social scientists and public and private sector policymakers. The tools enable researchers to create workflows to run their own simulations, visualize and analyse results, and publish them for future discovery, sharing, and re-use. This facilitates development and sharing of social simulation resources within the urban planners and social science community, encourages cooperation between model developers and researchers, and helps foster adoption of simulation as a research method and as a decision support tool in the public and private sectors. Design Tool is an application proposed by Predrag Šiđani, which has its starting point in Lynch’s propositions about city and urban form. Lynch’s theory of urban form and its hierarchical structure of main urban elements were applied, together with his concept of cognitive mapping, to a conceptual model of the Design Tool.

This is the second post in the MetaMap series about mapping. You can follow the conversation on Twitter, Google+, Diaspora, or Facebook through the #metamap hashtag.

credits: Giorgia Lupi and Gabriele Rossi (accurat.it)
acknowledgements: texts above are part of the UrbanSensing project
Design Week Tweets: Accurat with Marco Vettorello (data gathering) and Paolo Patelli (data processing and visualization)
Thanksgiving: Accurat with Marco Vettorello (data gathering and processing)

Comments: (0)

#followarch CONTROPROGETTO | diffondendo senso di appartenenza

Category: #follow+#followarch+⚐ IT+Intervista

Nella nostra sezione #followarch, oggi abbiamo il piacere di aggiungere una fantastica chiacchierata con lo studio “Controprogetto: la cultura del fare per diffondere senso di appartenenza“.

Controprogetto è nato nel 2003, quando i suoi 4 componenti ancora studenti, entrarono a far parte del popolo di associazioni, artisti ed artigiani che dagli anni 80 animava la Stecca degli Artigiani,  ex fabbrica del Quartiere Insula di Milano. Destinata alla demolizione da un grande progetto urbanistico, nel 2003 La stecca degli Artigiani divenne il luogo di riferimento per coloro che sperimentando una riqualificazione urbana partecipata, sognavano un contro progetto per il quartiere. continue reading

Comments: (0)

#followarch TAM ASSOCIATI

Category: #follow+#followarch+⚐ IT+Intervista

Nella nostra sezione #followarch, oggi abbiamo il piacere di aggiungere una fantastica chiacchierata con lo studio TAM associati.

“TAM sostiene una cultura dei diritti
TAM partecipa ad uno sviluppo responsabile […]”

Lo studio TAM associati si definisce un “progetto collettivo che unisce professionisti attivi nei campi dell’architettura, dell’urbanistica, della progettazione del paesaggio, della conduzione di processi partecipativi e didattici, della grafica e della comunicazione sociale” operativo come studio dal 1989 con sedi principali a Venezia, Bologna, Parigi. continue reading

Comments: (0)

LAN architecture* :: Migration as Mutation

Category: ⚐ IT+architettura+città+Intervista+migration as mutation

francobollo

E’ da quando siamo tornati dall’esperienza a Madrid che ci interroghiamo sul continuo migrare degli architetti italiani all’estero

continue reading