Three weeks ago (Juny 5th-8th ) we were in Linz, Austria, invited by Roland Krebs for a lecture and a workshop, part of an event called Identity City Lab, which is part of the Creative Region program.
The workshop, lead by local collective Schwemmland and Ecosistema Urbano, was aiming to provide some fresh insights and proposals about the eastern harbour area of Linz, a big extension of former ‘schwemmland’ (alluvial land) turned into an industrial area during the second part of the past century.
Some context
The area highlighted in the first image has been slowly fading out of the citizens’ imagination and become a ‘forgotten’ part of the identity of Linz. Tourist maps end right before the border of that area, which is still one of the most important connections of the city with the Danube and with its own history.
Tourist city map – Click to View PDF
Nowadays, the area hosts an active industry and a working logistic transportation system by rail. Interestingly enough, it contains patches of different uses scattered between the industrial facilities: nature (even protected species live there); cultural or recreational zones like an airfield; private gardening and traces of former agriculture; restaurants and small street stalls that sell food to workers and passersby.
Despite the long decades of industrial activity, the 8 meter deep water in the north-eastern docks is usually calm like a mirror and crystal clear… although during our stay it was very muddy due to the flooding that had happened just a couple of days before.
A basin between the docks – deep, calm water forgotten by the city
Some of the docks were recently filled in order to continue the industrial development of the area, which raised some concerns but can also be seen as an opportunity for the city of Linz to re-think its relation with the harbour and the water.
Here comes urban development: filling at one of the docks
Activities
The workshop started with a guided tour by bike around the area, which gave everyone a clearer insight on its different aspects and the opportunity to meet interesting people living and working there. Then we had a first work session at Schwemmland’s office.
Bike ride by the river
This aerodrome runway is not somewhere in the countryside – it’s right at the harbour!
Traditional food stall between the office buildings
The rest of the workshop took place at the Tabakfrabrik, a ‘great’ (both ‘good’ and ‘big’) example of industrial architecture by Peter Behrens and Alexander Popp finished in 1935, which is now being transformed in a cultural center. Some light and temporary structures built of wood, textile and truss systems created a human-scaled space for everyone to work comfortably in the long hall of the second floor.
Working inside the Tabakfabrik, an amazing industrial building of the early XX century
The participants, divided in small groups or couples, worked in quite different approaches, trying to imagine how the new industrial development that is planned for the area could be made compatible with some other uses or initiatives in order to bring that calm, clear water surface and its surroundings ‘closer’ to the city.
Outcomes
Despite the short time we had for developing them, there were some interesting proposals, so we ended up with a set of complementary ideas that will be presented to Linz AG, the company that manages almost every aspect of the city’s operation, maintenance and development.
An urban kitchen which could act as meeting point for the people working in logistics, industry, creative offices and artistic workshops and become a catalyst for activities, designs and actions on site.
An extension of the typical tourist map of Linz, making emphasis on a west-east axis, departing from the main square and connecting cultural facilities and lively urban places in a chain that would lead to Harbouria, a citizen-driven ‘city’ floating in the harbour.
Extending the tourist map and creating a ‘urban life chain’ from the center to the harbour
Harbouria – a floating ‘cuty’ in the docks
A very critical, almost poetical approach, which stated that the spontaneous activities in the harbour area should be preserved without a direct intervention. They talked about what could happen in the spaces “in between” the planned uses such as industry. Could we respect these emergences without trying to plan them?
Explaining how to keep spaces of opportunity without directly pointing at them
One of the proposals was to always keep a public fringe always available and accesible right on the border between the ground and the water. Simple to explain, but with very significative potential results.
And another one approached the place from the point of view of nature: letting the ecosystem take part of the docks back and creating a quiet and slow natural cycle inside the human hectic cycle of production.
We hope that the city will take these suggestions seriously and develop them further. The harbour is an amazing space where the city and the Danube really meet each other, and it shouldn’t be neglected as a potentially valuable public space.
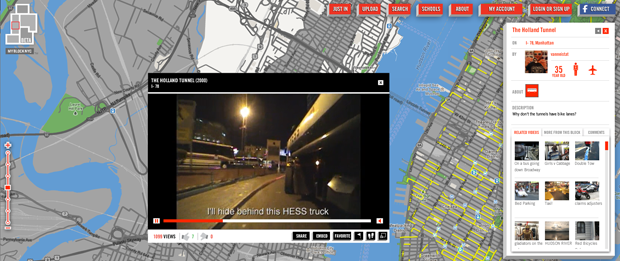
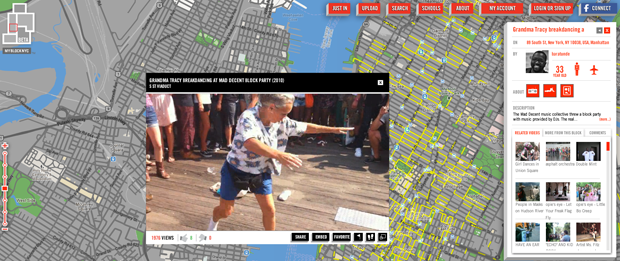
Today we present a New York based video mapping project, MyBlockNYC. They define their project as:
MyBlockNYC.com is an interactive video mapping website that captures and presents personal video accounts of life and culture in New York City in order to create an intimate, evolving, and complete portrait of the great city. Users upload videos geographically, creating the first fully interactive video map of New York City.
The MyBlock Assignment is:
Share the moments you see on the wild streets of New York City. You can upload videos you already have on your cell phone and computer, or explore the city and capture what you see. Each video should be shot outdoors and take place on a single block.
I interviewed Alex Kalman, founder of the platform.
Here’s a few examples of videos on the platform:
The Holland Tunnel
Grandma Tracy breakdancing at Mad Decent block party
Jimmy Justice
This is the second post in the MetaMap series about mapping. You can follow the conversation on Twitter, Google+, Diaspora, or Facebook through the #metamap hashtag.
Accurat is an information design agency based in Milan and New York, founded by Giorgia Lupi, Simone Quadri and Gabriele Rossi in 2011.
They define their work as the following:
We envision and identify new ways to structure information, revealing and addressing latent needs, desires and opportunities. Basing our methods on the design thinking approach, we specialize in providing our clients with consultancies, services, and products related to information design. Focusing on how information is transforming networks, cultures, contexts, and behaviors is an attempt to understand the future, a demonstration that it can be intercepted and designed.
I interviewed them about Big Data base maps and about their ongoing work in mapping: ✳Urban Sensing.
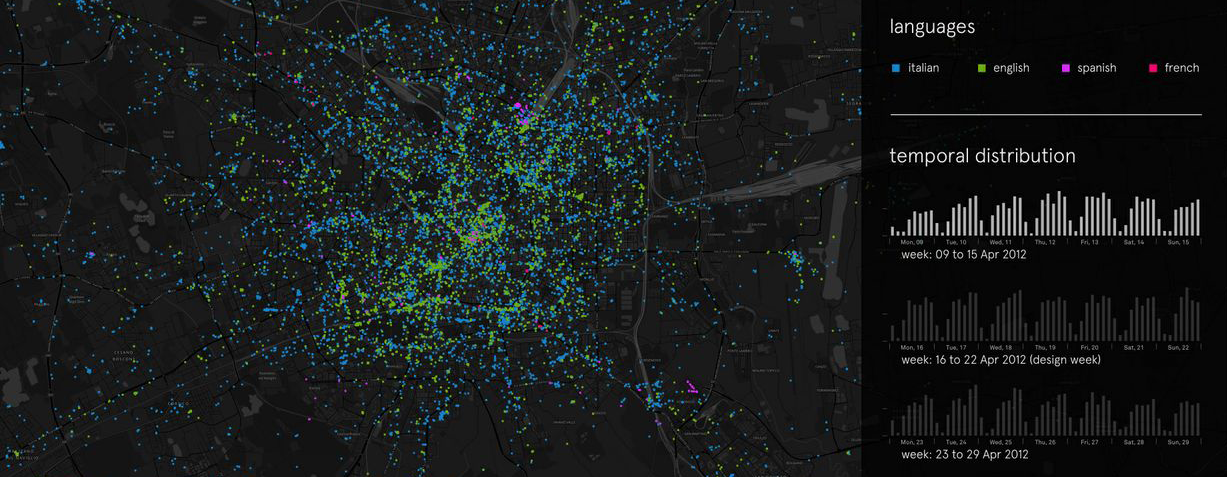
Experiment of Tweet mapping in Milan during design week
1. How did you get to the practice of mapping?
To us, mapping could be seen in a broader context as “structuring information”.
To start off, it’s not needed to say that information related issues are at the core of any design project that deal with cities, public services, society, and behaviors regardless of scale. Particularly, we have always been interested in urbanrelated projects that deeply rely on information: contexts, analyzing data, designing analytical tools, and visual narratives that provide awareness and comprehension of changing urban dynamics.
In our past entrepreneurial experiences, at Interactiondesign-Lab, we experimented working between the intersection of information systems and urban dynamics within the design of the Plan of Services for the Municipality of Milan (developed between 2009 and 2010). We designed a plan not to be intended as a product or document, since it was developed as a continuous process of listening, monitoring, reporting, and crossing the needs and the offers in terms of services of the city.
We designed 2 tools at 2 different scales, the macro scale of the city and the micro scale of the neighborhood. These tools don’t define what services we plan to have, but they give directions on how to cross the demand and the possible answer in terms of services in a meaningful way. It was, in fact, an information design project.
2. In what way do you obtain and treat the data for your mapping?
A big mapping project we are currently working on and coordinating at Accurat is ✳UrbanSensing.
The ✳UrbanSensing project is a EU funded project which aims to design and develop a platform for extracting patterns of use and citizens’ concerns with city spaces, through robust analysis of User Generated Content (UGC) shared by city users over social networks and digital media. The platform will allow the user to analyze citizen’s perceptions related to specific geographic areas and understand how population reacts to new urban policies within participatory mechanisms.
Novel digital and telecommunication technologies can be deployed to integrate data-sharing platforms within the spatial dynamics of the city. If properly analyzed, geo-tagged and User Generated Content (UGC) coming from Twitter, Facebook, Foursquare, or Flickr can be useful in the creation of meaningful, real time indicators of people’s perceived and communicated urban experiences. Through natural language and network analysis, it is possible to identify the nested micro-narratives that shape the behavioral and semantic background of a place and to extract specific urban indicators.
Our assumption is that by conducting an analysis of datasets based on text extracted from UGC we can recognize multiple stories, as they emerge, overlap and influence each other, unfolding from city users’ mental representations and spatial experiences of city spaces. In fact, by providing tangible, visible references, the spaces of actual buildings and cities participate in constructing the meaning of the speech that articulates itself within them and as conversations unfold within particular architectural settings, they build up increasingly dense webs of shared understanding grounded -at least in part- on the points of reference that these settings afford.
Thus, within ✳UrbanSensing we are mainly gathering and analyzing geo-localized social media data (Twitter, Foursquare, Instagram, and Flickr); and such data will be properly integrated and compared with more traditional sources of urban information (socio-demographic territorial data, real-estate indicators, and environmental data) to produce dynamic and evolving images of the city as used and perceived by its’ citizens and temporary users.
3. What is the application of open source/social network-based mapping you are interested in the most?
If properly analyzed, integrated, and interpreted, Social Media data can help stakeholders at the urban scale to “forward-looking” innovation strategies based on a thorough analysis of people’s contexts, interests, and needs.
Among the possible urban topics this data could partially answer to, we will narrow them to the following particular issues:
Rapidly intercepting emerging urban dynamics, such as gentrification processes and precise areas’ evolution through time (for identifying trends in areas’ related phenomena, in the exact moments they’re originated, with the possibility to add more dynamic parameters to those used by the real estate market);
Understanding which are the factors (e.g. morphological aspect, aesthetic quality, public service availability and density, infrastructure granularity, cultural scene, and commercial service) that attract people in particular places (areas, neighborhoods), and how this evolves through time;
Understanding which kind of people (language / on-line influence / demographics) are in specific areas at particular moments;
Highlighting patterns of movement throughout the city (from which places people in an area come from? where are they going? are they residents, visitors, or ordinary city users?);
Interrogating data about a particular topic (e.g. brand name, event name) or about a selected theme (e.g. cultural phenomena, cutting-edge topics) to see how things evolve spatially and temporarily.
All this, to provide a better understanding of an areas’ related phenomena and evolution, to redefine actual districts’ fixed boundaries and to see where public services, policy’s infrastructures, design interventions, or activities could be better located, and to try and build models to predict near-future evolution;
Experiment of Tweet mapping in New York
4. What is the next phase of development that your research is undergoing?
One of the forthcoming steps of our project is to gain a deeper understanding of:
How such data sources could be interpreted (in terms of sharing behaviors and motivations) to get actual and consistent insights;
Which are the real limits of such data in terms of research (e.g. demographic, digital divide, economic, location-related);
How to overlap and integrate such data sources with more traditional layers of territorial information (e.g. socio-demographic data, income data, rental costs, ethnic data, and environmental ones such as pollution and sanitary inspections, etc.) to finally display extreme high-resolution views and interpretations of territorial related dynamics.
How unexpected patterns and meaningful questions could emerge from data themselves.
In fact, UGC differs from conventionally produced geographic information in several aspects. The source of the information, the technologies for acquiring it, the methods and techniques for working with it, and the social processes that mediate its creation and impact. Traditionally, geographic information has been produced by experts and institutions, therefore, certain types of information have been privileged and other types ignored, and even marginalized. UGC’s represent a powerful shift in sources, content, characteristics, modes of data production, mining, sharing, dissemination, and use. Therefore, a wide set of meaningful questions (that have been partly investigated for “conventional” geographical information) need now to be re-investigated, and a framework on how to use these information still has to be built.
In parallel, we are designing and developing the technological architecture and the actual interface allowing us (and lately, stakeholders) to perform specific queries and produce such dynamic maps in a very visual and intuitive way.
5. What are you personal references for the theme of mapping (from ancient to contemporary ones)?
We would here focus on emerging critical practices that propose new models to describe the city that stresses the collaborative and constructionist dynamics of the mapping process.
The underlying idea of this approach considers the geographic, urban experience through a network of multiple fragmented temporary data and information generated by human-place interactions and collaborative dynamics. Based on these theoretical premises, several experimental GIS-based applications focusing on cartography emerging from users’ perceptions and activities have been produced.
As Zook & Graham noticed, traditional methods used to register users’ perceptions and activities about the cities and its fruition – like surveys and ethnographic reports – seem to be inadequate to meet the need of information of contemporary society both because they require a considerable amount of resources (in terms of time and money) and because they do not consider the temporal dimension.
Senseable City Lab explored mapping systems based on UGC on several projects like World’s Eyes and Obama One People.
Current City, a European foundation committed to address long-standing city management problems in unconventional ways, explored the potential of urban mapping based on real-time data streams on users’ location coming from telco providers.
Christian Nold’s work focused on in-depth research of technological tools in order to unravel their social and political layers, and on building socially constructive, bottom-up devices, that take the form of practical tools such as in the Bio Mapping project.
Bio Mapping is a research project based on biometric sensors that can be worn by users provided with a GPS device able to trace their paths through the city, and that register specific parameters (e.g. emotional status in a specific place or situation) and publish them as user generated content on specific emotional maps. This project explores tools that allow people to selectively share and interpret their own bio data. Within this framework, Nold investigates how the perceptions of a community in an environment can change when they become aware of their own intimate emotional status.
Some other recent GIS projects focused on the idea of building open tool-kits that could be used by the community of students and practitioners of urban design, planning, and management. The Centre for Advanced Spatial Analysis at UCL created MapTube as a free resource for viewing, sharing, mixing, and mashing maps online and the NeISS project (National e-Infrastructure for Social Simulation) provides a platform to meet the demand for powerful simulation tools by social scientists and public and private sector policymakers. The tools enable researchers to create workflows to run their own simulations, visualize and analyse results, and publish them for future discovery, sharing, and re-use. This facilitates development and sharing of social simulation resources within the urban planners and social science community, encourages cooperation between model developers and researchers, and helps foster adoption of simulation as a research method and as a decision support tool in the public and private sectors. Design Tool is an application proposed by Predrag Šiđani, which has its starting point in Lynch’s propositions about city and urban form. Lynch’s theory of urban form and its hierarchical structure of main urban elements were applied, together with his concept of cognitive mapping, to a conceptual model of the Design Tool.
This is the second post in the MetaMap series about mapping. You can follow the conversation on Twitter, Google+, Diaspora, or Facebook through the #metamap hashtag.
credits: Giorgia Lupi and Gabriele Rossi (accurat.it) acknowledgements: texts above are part of the ✳UrbanSensing project
Design Week Tweets: Accurat with Marco Vettorello (data gathering) and Paolo Patelli (data processing and visualization)
Thanksgiving: Accurat with Marco Vettorello (data gathering and processing)
Maps and cartography have been, traditionally, tools to express and exercise power and have been used exclusively by a few people who held the knowledge. Nowadays, this practice is enriched by more and more nuances and gets contributions from all sorts of fields.
We find maps exposed in galleries, painted in the streets, and drawn as acts of performance art, dealing with the necessity to express identities and culture in mass societies. We see maps based on a huge amount of information and realtime data coming from social networks, which were only made possible once computer science and the web appeared, thus enabling us to have an unprecedented knowledge of what’s happening in cities. Cartography is even used as a tool to emphasize critical aspects of our society that, otherwise, wouldn’t be noticed and as a platform to solve these same problems.
All of these multiple approaches are becoming a common experience as they are often the result of a participative process and are shared as open source information. On one side, this shows the need of understanding the growing complexity of reality and the quantity of information that is being produced. On the other side, it expresses the need to re-create an identity through self-knowledge in the actual context of globalization.
I have decided to examine the current state of cartography due to the influence it’s having on many fields today, with the power to be transversal with the classical arts. This research is an ideal continuity with the exhibition that was recently hosted by Caixa Forum (Madrid), on contemporary cartographies. The exhibition started with the situationist and surrealist approaches that opened up the mapping discipline, introducing contaminations from other fields (art, politics, statistic…) overcoming the scientific point of view, showing it lacks the description of reality.
The aim of my investigation is to make a MetaMap, a research on different types of maps I come across, in this meta-map we will see the multiplicity of possible outputs, as well as the common points between them. Taking advantage of the web and its horizontal-knowledge rather than the classical vertical and deepened knowledge. The research was made seeking projects and asking the same set of questions to the authors. These interviews should make it possible to separate the different tendencies and intentions of mapping, tracing connections, and intersections. I manage to focus on particular authors by interviewing them to better explain their work.
This is the list of posts published in this series so far:
The posts in this series by our collaborator, Tommaso Miti, were be published once a week under the MetaMap category. You can follow the conversation in your favourite social network through the #metamap hashtag.
Next Thursday June 20th registration will be closed for the International Summer School, in which more than 20 teachers and 40 students will develop new forms of architecture, particularly related to tourism, in the valley of Solanas and in the coastal area in the south-eastern part of Sardinia.
Save the dates: July 3rd – July 13th
Special deal for European students: 50 € fee + 100 € for 10 days lodging
Learn more about this experience: coastal-landscape-architectures.blogspot.it
Vista general de la sala – Foto: Emilio P. Doiztúa
La pasada semana asistimos en Madrid a las jornadas del Plan Nacional de Formación Urbact para Grupos de Apoyo Local que os presentábamos en un post anterior. Durante esos dos días (6 y 7 de junio) se trabajó en una atmósfera de trabajo creativa y con gran participación de los representantes de los proyectos que se desarrollan en España en el marco de la corriente convocatoria 2007-2013 de financiación con fondos europeos. continue reading
Os dejamos un artículo de Irene Ayala Castro, ilustrado por ella misma, que es un condensado de una extensa investigación realizada durante su Proyecto de Fin de Carrera sobre un tema crucial en cuanto a sostenibilidad social y medioambiental:
Despilfarro en la cadena alimentaria | 1/3 de los alimentos producidos en el mundo van a la basura.
En el mundo 1 de cada 6 personas pasa hambre. Y la razón no es la producción insuficiente de alimentos sino el sistema global alimentario. De hecho se produce más de lo que necesitamos; y la demanda va en aumento. Se prevé que para 2050 se necesite un 50% más de producción de alimentos y esto sin tener en cuenta las pérdidas en el rendimiento y la superficie de cultivo como resultado de la degradación del medio ambiente.
Y mientras, sin ser conscientes de esto, nos permitimos desechar 1/3 de los alimentos que producimos.
Pérdidas y desperdicio en la cadena alimentaria
Comparación de desperdicios entre países en desarrollo e industrializados – Fuente: Elaboración propia
Tanto en los países en desarrollo como en los industrializados, cantidades inaceptables de alimentos se desperdician a lo largo de la cadena alimentaria por razones muy diferentes. En los primeros, esto es debido a limitaciones financieras, técnicas y de gestión en técnicas de recolección, almacenaje y refrigeración. En los segundos, el desperdicio está relacionado con los consumidores (FAO estima que en Europa y América del Norte se desperdicia entre 95 y 115 kg/año per cápita, mientras que en África subsahariana y el Sur/Sudeste de Asia sólo 6.11 kg/año) y con la falta de coordinación entre los agentes implicados en la cadena de suministro.
En la siguiente imagen se muestra el porcentaje de desperdicio en cada zona del mundo, por procesos a lo largo de la cadena alimentaria.
Fuente: Elaboración propia + Datos “Global food losses and food waste” FAO.
Sistema global alimentario en Crisis
La causa principal de la crisis alimentaria global es una combinación de la especulación (Esther Vivas lo explica muy claro en el siguiente video), el cambio climático, el bajo stock de cereales y su alta demanda, la expansión agrícola para biocombustibles que compite con los campos de cultivo para el consumo humano o de ganado y los altos precios del petróleo.
El aumento de los precios de alimentos de primera necesidad, como los cereales, pone en peligro la salud o incluso la vida de las familias al gastarse el 50-80% de sus ingresos en alimentos. La situación es realmente crítica para las personas ya bajo el umbral de seguridad alimentaria.
Fuente: Elaboración propia con datos del World Bank 2011
El aumento en la demanda de alimentos se debe a dos factores, el crecimiento de la población y los cambios en la dieta hacia un mayor consumo de carne.
La producción de carne es especialmente exigente en términos de energía, cereales y agua. Se necesitan 3 kg de grano para producir 1 kg de carne. Sólo un 43% del cereal producido está disponible para el consumo humano, el resto o se pierde o se utiliza para alimentar ganado. Con la previsión de un aumento de 37,4 kg/persona/año en 2000 a 52 kg/persona/año en 2050 de consumo de carne, las necesidades para la producción de esta podrían aumentar más del 50% en la producción total de cereales (Keyzer et al. 2005).
Incremento en la demanda y suministro de alimentos
Los campos de cultivo arrasan el paisaje natural de la Tierra. El suelo se ha convertido en una fábrica de alimentos. Están desapareciendo especies de animales y plantas y también está cambiando el clima. Si se sigue por este camino para 2050 el suelo productivo se verá reducido en un 25% por el cambio climático (Fuente: “The environmental food crisis” UNEP), degradación del suelo, pérdidas, escasez de agua y altos precios de fertilizantes.
Las consecuencias de esto serán: aumento del precio de los alimentos y mayores inversiones en el desarrollo agrícola para compensar disminuciones en el rendimiento.
Degradación medioambiental – Fuente: Elaboración propia + “The environmental food crisis” UNEP
¿Cómo se podría aumentar la disponibilidad de alimentos sin aumentar la producción? Mediante la reducción de las pérdidas y desperdicios a lo largo de la cadena alimentaria.
Análisis de los agentes y cómplices voluntarios que intervienen en la cadena y acciones/medidas propuestas:
Fuente: Elaboración propia + ‘Despilfarro’ de Tristram Stuart.
En esta imagen, además de hacer un análisis de los agentes y cómplices voluntarios implicados en la cadena de suministro y los problemas/errores clave, también se establecen unas medidas para darles solución.
El consumo de pescado constituiría un 10% de nuestra dieta. En la actualidad se capturan entre 110-130 millones de toneladas de productos del mar cada año. De los cuales 70 millones de toneladas serían para el consumo humano, 30 millones de toneladas se convierten en harina de pescado y los otros 30 millones de toneladas se descartan. La razón del descarte es que los peces son demasiado pequeños o no son las especies objetivo de pesca. Muchos de estos descartes son especies aptas para el consumo.
Debemos proponer el consumo de especies menos conocidas y abundantes (además suelen ser más baratos que los convencionales).
Un supermercado tira de media 100 kg/día (Fuente: Aproximación directa y FAO). Las razones son: mantener stocks para que siempre haya existencias de los productos demandados por los consumidores que acaban caducando, envases defectuosos (sin afectar al estado de la comida un pequeño roto o marca en el exterior), productor próximos a caducar. Por ejemplo, los yogures son desechados 5 días antes de su fecha de caducidad y los huevos 20 días.
Lo que se propone en este caso es que se done o redistribuya todo excedente que no pueda venderse.
Los supermercados Thorntons Budgens proponen en este video que primero, los productos próximos a caducar se pongan en oferta, después, lo que no se venda, que se cocine in-situ y en último lugar se composte y utilice como abono en su huerto.
Os recomiendo el video de investigación de “Fecha de caducidad” de La Sexta.
El movimiento artístico Excedentes/Excess, plantea dar una solución digna al acto de recoger de la calle comida desechada de supermercados y restaurantes. Idea una Propuesta de Ley enfocada al aprovechamiento de los excedentes alimentarios.
El gurú de las cuestiones sociales y medioambientales de la alimentación, Tristram Stuart, trata en su libro “Despilfarro. El escándalo global de la comida” (lectura imprescindible) el tema desde su experiencia personal e investiga las cuestiones sociales y medioambientales de la crisis alimentaria y lo que se puede hacer para remediarla desde la escala global hasta la domestica.
Tristram es el creador el movimiento “Feeding the 5000” que consiste en la recogida de productos de supermercados y restaurantes que supuestamente no quieren los consumidores, la elaboración de un menú y dar de comer a 5000 personas gratis.
Fuente: Elaboración propia + Tristram Stuart y grupo feeding 5000 -Food waste pyramid for London
En el mundo desarrollado se desechan los alimentos sin tener en cuenta el impacto que conlleva social y medioambientalmente su producción. Y no solo su producción, sino también los residuos orgánicos que se entierran en vertederos y al descomponerse emanan gas metano.
Tenemos que ser conscientes de que nuestro despilfarro afecta al mundo. Además esto no es algo ajeno o lejano; en Europa, 43 millones de personas están en peligro de pobreza alimentaria.
Recordando las palabras del filósofo ingles John Locke, en donde exponía la idea de que quien dejaba la comida pudrirse en su propiedad perdía el derecho a ella:
“Pero si estos bienes perecían en su posesión sin que él hubiera hecho uso de ellos; es decir, si los frutos sacados de la tierra se corrompían, o si la carne de venado se echaba a perder antes de que él pudiera consumirla, ello constituía una ofensa contra la ley común de la naturaleza… Y era ciertamente cosa insensata y deshonesta, acumular más de lo que podía ser utilizado. Si, a fin de que esos frutos no se pudrieran inútilmente en su posesión, regalaba una parte a otra persona, puede decirse también que estaba haciendo uso de ellos… Pues lo que rebasaba los límites de su justa propiedad no consistía en la cantidad de cosas poseídas, sino en dejar que se echaran a perder, sin usarlas, las que estaban en su poder”
John Locke, Segundo tratado del gobierno civil (1960)
En un mundo con escasez de recursos naturales (tierra, agua, energía, fertilizantes…), y donde hay soluciones rentables para producir suficientes alimentos seguros y nutritivos para todos, reducir las pérdidas y desperdicios tiene que ser una prioridad. Y el primer paso es ser conscientes y comprender la magnitud del problema.
El próximo viernes 14 de junio, Belinda Tato participará en el ciclo de Conferencias La Ciudad Amable, organizado por la Consejería de Fomento y Vivienda de la Junta de Andalucía.
Este programa tiene por objetivo incidir en la mejora de la calidad del espacio urbano y su activación social y cultural. Durante el presente año La Ciudad Amable está llevando a cabo acciones de sensibilización, formación e intervención sobre la ciudad, el espacio público y la movilidad sostenible.
La conferencia es abierta al público y tendrá lugar en la Escuela de Arquitectura de Málaga. Tras la conferencia habrá un mesa redonda que contará con la participación de Manuel Calvo —Biólogo y Especialista en movilidad y sostenibilidad—, Ciro de la Torre —Profesor de Proyectos de la ETSAM— y Juana Sánchez —Profesora de la Urbanística de la ETSAM—.