I would like to share with you my personal experience in a ‘Design-Analyse-Build’ way of design. Some of you might think, that it sounds not so innovative and most of the architects work in that way, that’s probably could be the truth, BUT there are some specific tips that make this experience unique.
In this post I will refer to the workshop that I shared in IED Torino Master SUS with the main coordinators ARCò and MCArchitects studio, about designing an off-grid sustainable school for Palestine, Gaza_Rafah.
Firstly, I want to meet you with a work plan, that we were followed:
1. Climate analysis of an area
2. Analysis of the state conditions and local features of the area
3. Understanding the type of users and their needs
4. Environmental strategies selection
5. Concept creation
6. Design process
7. Shadow, daylight and glare analysis using Ecotect
8. Model 1:1 scale prototype
The first step was to analyse the climate of the area to understand the possible environmental strategies we can use and make a list of parameters that is better to avoid or conversely exploit during design process. The most tricky stuff was to find the weather data for Palestine, because nowadays all the information about it is classified, due to the war. Finally we had to use weather data of Beer Sheeva that located nearby in territory of Egypt.

The result of a Climate analysis using
During most of the year temperature is above the comfort zone.. The winter is short, but is noticed with a humid winds. The summer period lasts almost 7 months and accompanied with high temperature of the air and wind.The difference between the highest and lowest temperature during the day is about 10°.With this climate is important to orient building to protect it from the direct sun during summer and to capture it during winter. Also the building should be covered from strong winter wind,but use the summer ones.
The second step was to find out the location of Rafah city and underline the main function of that place. One of the most important thing was to see the actual state of the construction site, that was almost impossible due to the hostilities.
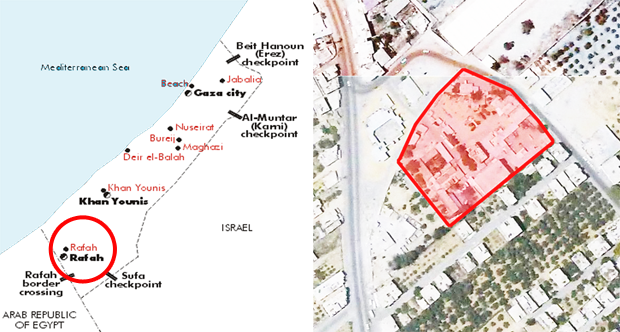
Site location. Palestine. GazaStrip, Rafah
Rafah is situated in the southern part of the GazaStrip in Palestine, at the border with Egypt. According to the peace treaty between Egypt and Israel at Camp in 1982, Rafah was divided into two parts. One part was assigned to Egypt, the other part to the Gaza Strip. Nowadays Rafah is the only point of importance in the country.
The third step was to ‘meet’ the users. In this case we had to try being in their shoes, imagining lifestyle of a kid who was born and had been living all of his life in a war situation, always surrounded with fences and swaying wire in a lack of green safety spaces and entertainments.
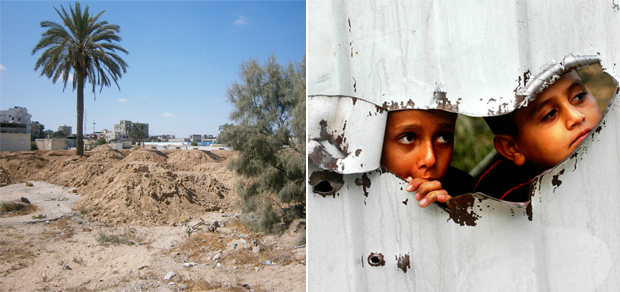
The site is located in the central empty area of Rafah. It is surrounded with residential houses and a big warehouse.In the real-time the site is full of excavated earth, because of the erasion of the previous construction, after the bombing.
From 1948 the population of Palestine live in the war situation.. So the country has problems in many different fields, one of it belongs to children and it is lack of schools and areas for children activities
The fourth step was to choose the environmental strategies to follow to reach the off-grid building. This phase is strongly related to the climate analysis. In this case, is very helpful to see the vernacular architecture of a place to choose the right strategies.
 Image is made by Ekaterina Kozhevnikova and Sara Cicinelli|
workshop ‘Una scuola sostenibile’ in IED Torino
The fifth step is a sort of summary of all the strategies we chose for the building – concept creation. Concept is the phase right before the design process, so it was important to choose the right orientation, shape, functional zones etc. We were also advice to make a simple symbol or logo that would describe our project in few seconds, that finally could become sort of a brend.


‘The Earth is our school, so let’s make the school with earth!’
Image is made by Ekaterina Kozhevnikova and Sara Cicinelli | workshop ‘Una scuola sostenibile’ in IED Torino
One of the most important steps was analysis of the building with Ecotect, Autodesk 2011. For this project we had to make several calculations, such as: solar, shadow, daylight and glare analysis.
Usually shadow analysis is calculated for the longest and shortest day in the year, such as 21st of December and 21st of June. In this case we also did computings for 21st of march to get proper results and see if the overhangs are useful during al the year.
Solar analysis shows us the amount of sun hours that building surfaces receive during the day. It gives us the idea of facade protection from the direct sun. It also could be very useful to see the best position for the PV panels to let them produce the maximum energy.
Daylight factor analysis is the ratio of internal light level to external light level.A low asks for classrooms a 5% daylight factor. For art, craft, technological laboratories thatratio is even higher. Daylight can be used to offset the need for artificial lighting and hence reduce dependency and consumption on electricity and the greenhouse gas emitted. Effective daylight distribution must be achieved in a manner that brings visual satisfaction to the occupants.
Glare analysis is a calculation about number of direct sun or reflection coming from a very bright source outside the field of view. The reflection may cause discomfort as well as the additional annoyance of veiling or masking out the information which is being sought within that view. The result of analysis using
The final step was a model in 1:1 scale that we built-in one of the parks in Turin city. It was a great chance to ‘feel’ the construction and understand the weak and strong points of it. In my personal opinion, it was one the best parts of design, when you make the proof to your ideas and drawings, so you can be sure that the techniques you had chosen is stable and can answer to your expectations.
April 29, 2013
posted by Ecosistema Urbano

One of the most important challenges over the 13 years of history of Ecosistema Urbano has been to communicate what we do in a readable and attractive way. However, in everyday work, the priority has always been the urgent, immediate projects, so we kept postponing the time for making a structured presentation of our professional activity online.
This “EU portfolio” task has been present in all of our task management meetings, always at the end of the “to do list”. But that’s over!
The Ecosistema Urbano Portfolio: What we do
We have finally put ourselves to the task with dedication and we are pleased to present our portfolio: a selection of our works and proposals, showing pictures, diagrams, plans, related links to publications, etc … A selection that, while not yet complete, is organized by categories, tags and years, making navigation more effective.
From now on, from our home page www.ecosistemaurbano.com or from the header of this blog, you can access www.ecosistemaurbano.com/portfolio. And this is more or less what you will find:

We carried an internal research on portfolio sites we liked, and as a result we have gone for a responsive layout, an adaptable grid structure showing all the projects at once, plus a sidebar menu, where you can find the main information about our firm as well as 3 different navigation systems:
– A general classification of projects by types
– A more specific classification according to themes
– A yearly index
We have chosen this simple web structure with the aim of keeping it updated (which, so far, we are managing to do!), and of course the website is a “work in progress” itself. This way, we didn’t have to wait til all the contents were uploaded to make it public. We have uploaded so far 20 of our most relevant works, but we plan to add more in the months to come, so that you can get an overall impression of “what we do”.

We invite you to check some of the presentation sections on the sidebar menu, that have been recently updated:
– About us is a complete presentation of Ecosistema Urbano, who we are and what we do.
– On Articles + Papers you can read some of our written contributions to international architecture magazines and other publications.
– Under the label Publications you can see where our projects have been published so far and have access to previews of some of these publications.
– You can also take a look to the Lectures + Exhibitions and Education + Workshops sections for more information (including related links to most of them).
Linkable, downloadable
We find the typical architect’s portfolio websites, usually made in Flash (a legacy from the ’90s, but still very common), quite frustrating. They don’t allow you to link to a specific project, and forget about downloading an image! With such limitations the message of those websites is a clear “keep your hands off my stuff”… and we do want you to get your hands on our staff!
So we have made sure you will be able to easily link to any project, year, tag or category (or even a specific image), to view the images in a good resolution, and to download them.
Reconnecting our online presence
When designing the poftfolio page we noticed something else: On top of all our websites (about, portfolio, blog, video channel), we were missing a way to link and navigate between them.
Now we have tried to address this issue by creating a common header syle for all the sites, which includes a menu with links and a changing color that matches the ones displayed in our main page: ecosistemaurbano.com.

We hope you enjoy it! And please, feel free to make any comments on it, we will appreciate your feedback. Thank you!
April 23, 2013
posted by Katerina
 The water footprint of an individual, community or business is defined as the total volume of freshwater that is used to produce the goods and services consumed by the individual or community or produced by the business.
The water footprint consists of three components: the blue, green and grey water footprint. The blue water footprint is the volume of freshwater evaporated from the global blue water resources (surface water and ground water) to produce the goods and services consumed by the individual or community. The green water footprint is the volume of water evaporated from the global green water resources (rainwater stored in the soil as soil moisture). The grey water footprint is the volume of polluted water that associates with the production of all goods and services for the individual or community. The latter can be estimated as the volume of water that is required to dilute pollutants to such an extent that the quality of the water remains at or above agreed water quality standards.
The past century has brought a lot of changes, like the explosion of human population, the creation of an expansive global economy and the increasing technological development. All of them have put unprecedented pressures on water. More specifically, our growing appetite for water-intensive food and manufactured good, the construction of large dams for hydro-electricity and irrigation, and the massive discharge of industrial waste into limited freshwater sources, have made water an increasingly limited and expensive resource.
Despite this obvious fact, people use large amounts of water: drinking, cooking and washing, but even more for producing things such as food, paper, cotton clothes, and almost every other physical product. This water can be named as virtual water.
 The virtual water content of a product (a commodity, good or service) is the volume of freshwater used to produce the product, measured at the place where the product was actually produced.
It refers to the sum of the water use in the various steps of the production chain. The virtual-water content of a product can also be defined as the volume of water that would have been required to produce the product at the place where the product is consumed (consumption-site definition).

Image made by Virtual water | facebook.com/virtualwater
Here are some examples of water footprints of daily products , calculated by Unesco-IHE Institute for water education, Netherland

Image made by Hoekstra and Chapagain 2008
These numbers are kind of shocking! Aren’t they?
So, let’s try to calculate our daily footprint and investigate the solutions to reduce the numbers as much as we can!

Image made by GOOD and Fogelson-Lubliner
Water footprints can be hard to calculate, depending on how far up the chain of production you go, since everything you eat and buy used some water to produce. With our latest Transparency, I give you some examples of how much water is used in some of your daily activities, so that you can begin calculate your footprint and try to reduce your gallons.
To help put things in perspective, think about this: your standard trash barrel holds 32 gallons and a mid-sized passenger car-if pumped full of water has room for a little more than 800 gallons. So, the difference in the amount of water it takes to produce a pound of chicken and a pound of beef is enough to fill almost two whole cars.
Which result have you got?
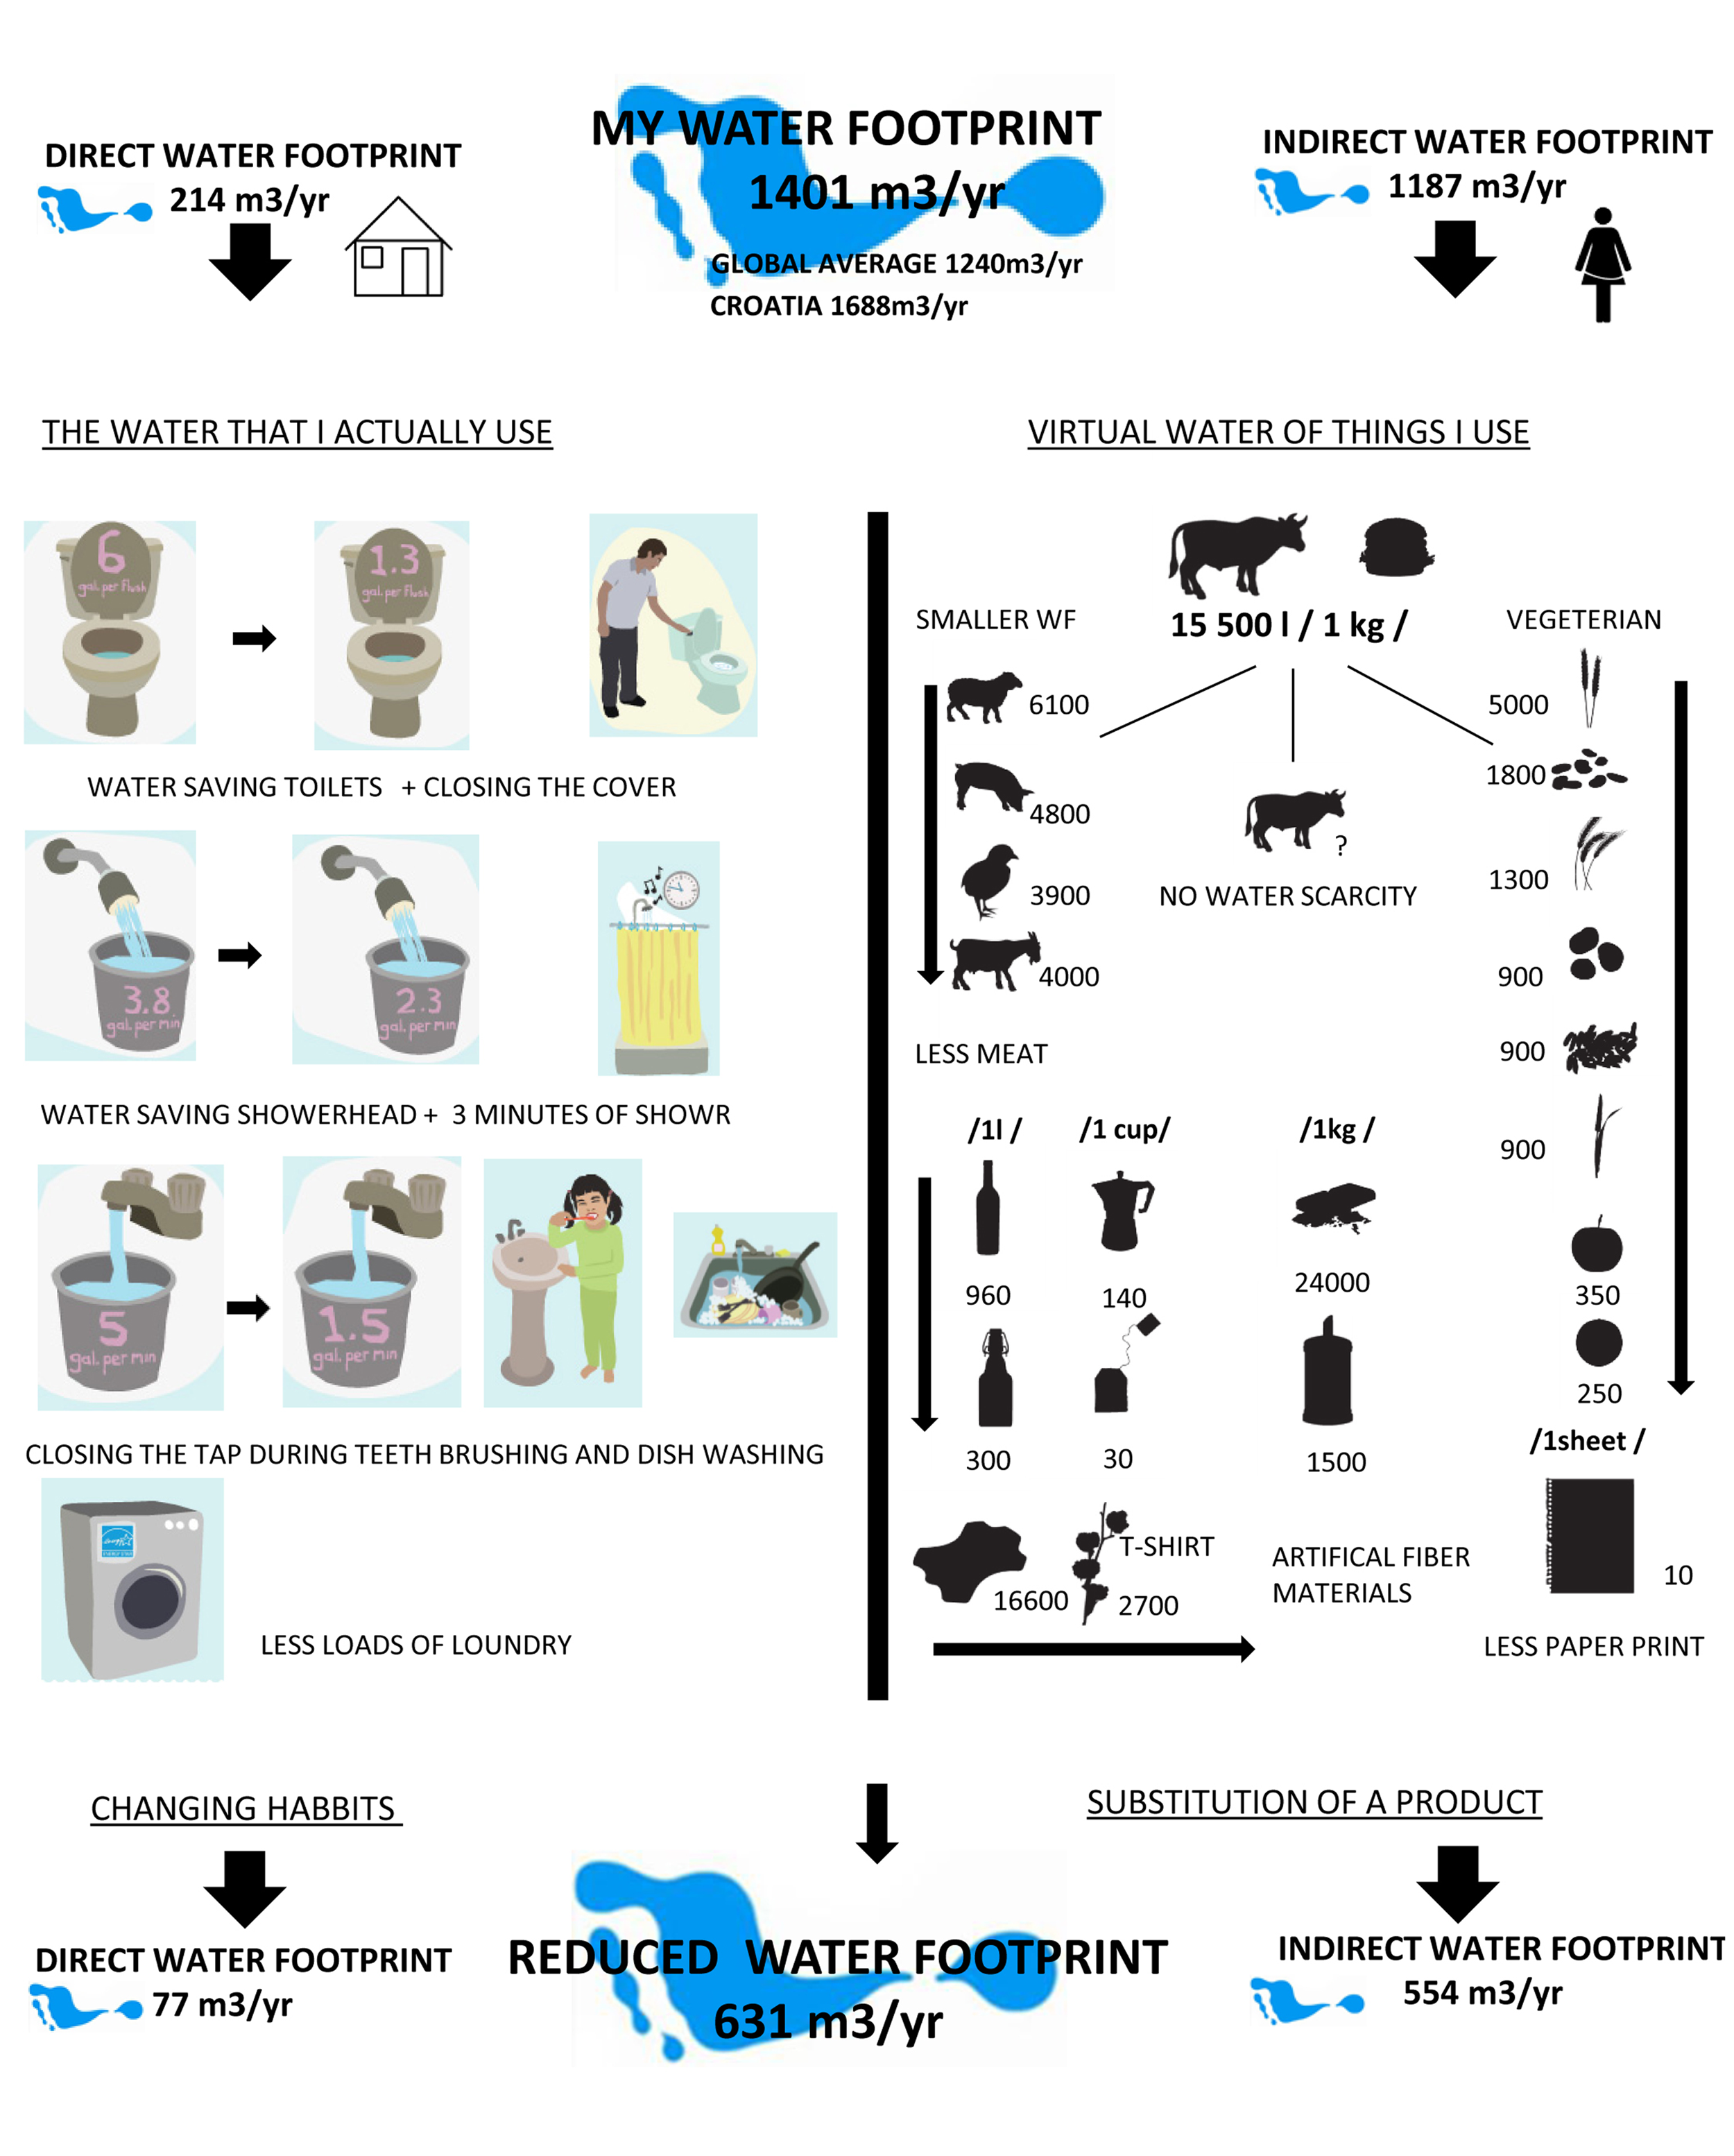
Let’s compare it with the water footprint calculation of one friend of mine, Croatian architect Ana Bilan that did some research in that field.
According to her calculations she was able to reduce her water footprint more than twice, which sounds really impressive! So it was a matter of changing her habits, decreasing the direct water footprint and also the types of food she eats and products she uses to get a better result with indirect water Footprint.

Image made by Ana Bilan | research about MY WATER FOOTPRINT | for IED Torino Master SUS
If you become really interested in knowing how much water you personally use per day, you can follow this link and make a simple calculation:
Water footprint calculator (adults)
And you can also involve your kids into the idea of water preservation!
Water footprint calculator (kids)
Here are some facts to convince you to be a water guardian:
- The average American lifestyle is kept afloat by nearly 2,000 gallons of H2O a day—twice the global average;
- 46% of people on the earth do not have water piped to their homes;
- Women in developing countries walk an average of 3.7 miles to get water;
- In 15 years, 1.8 billion people will live in regions of sever water scarcity…
A complete update of facts and stats about the water global crisis has been recently (2017) published by John Hawthorne, available at this link.
And remember – Every Drop Counts!