Cities, organizations increasingly vast and uncontrolled, crystallize today most social and environmental issues. Intensification is a hot topic as antidote to urban sprawl and overconsumption of the territory, but how to live in the dense city, make it livable and desirable? This paradox between individual aspirations and the need to contain the growth of cities is a challenge for the architecture, the opportunity to imagine new types of habitats, for the collective economy of the soil, but offer a sense of independence and freedom in the use of space, from within and without.
Let’s find a simple example: to reduce private car use, many cities are trying to promote green transport methods, including cycling, which is highly valued by the local population that exhibits a strong “scientific, sporty and green” image. The cycle path network is growing, but the problem lies at the two ends: What do you do with your bike when you get to your destination?
The bicycle is the most efficient form of transportation ever devised, and it delivers a whole-body workout. Cycling consumes far fewer calories per mile travelled than cars, buses, or even walking. It is sometimes the fastest way to get around a city. Cyclists can zip around traffic jams and don’t have to fight for a parking spot because they can bring the vehicle home… maybe: Many homes aren’t bicycle-friendly, so bikes are either not used or not purchased.
The French architectural studio ‘HERAULT ARNOD architectes’ was faced with that problem in Grenoble, where they designed a sustainable residential house.
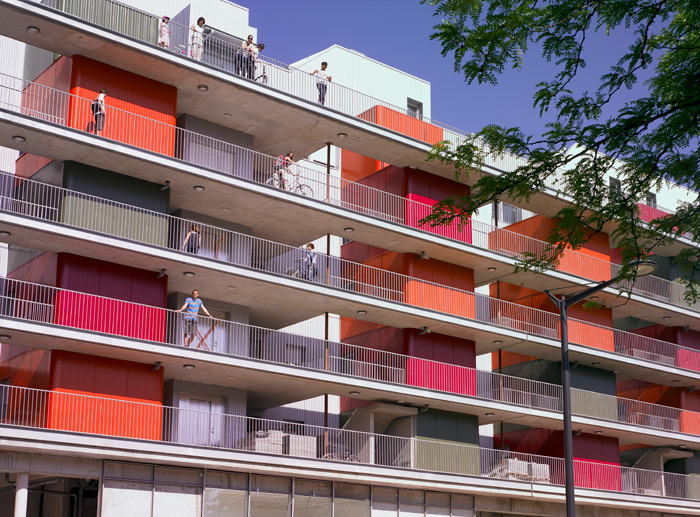
Image is made by Herault Arnod architectes | L’IMMEUBLE À VÉLOS |Grenoble 2006-2010
The project ‘Bike building’ has a system which makes possible to take one’s bike to the door of one’s apartment. The lifts are big enough to carry bikes; the corridors are wide and form a panoramic walkway with views over the mountains. People enter their homes as they would a house, from the outside. The architecture of the storage and distribution system is designed for a project situated at the end of the cycle path network. People will be able to reach their front doors on rollerblades, scooters, bicycles, etc., and then store their wheels in a safe place.
‘…This project was conducted as part of an order placed by the architects to 8 City of Architecture and Heritage, on the theme of a “Habitat densified environmentally responsible.” These projects were gathered in one part of the traveling exhibition “Living Green”, which was provided by the police Gauzin-Dominique Müller, and which was presented to the City of Architecture…’ say Chris Younes and Isabel Herault
Since the outskirts of Grenoble are layered with districts of detached houses which generate traffic flows that grow more intense and more extensive each day, it is time to think about urban housing that is more in tune with contemporary aspirations. What does a detached house have that an apartment does not? Amongst other characteristics, we identified the relationship with the exterior, which is more direct and special, the greater privacy, and storage capacity: according to a recent study, 40% of the surface area in detached houses is used to store various objects, food, clothes, tools, bicycles, windsurfers, skis, etc.
‘…>80% of the population would rather live in a detached house than in an apartment block in town. What does a detached house have that an apartment does not? Amongst other characteristics, we identified the relationship with the exterior, which is more direct and special, the greater privacy, and storage capacity: according to a recent study, 40% of the surface area in detached houses is used to store various objects, food, clothes, tools, bicycles, windsurfers, skis, etc….’ say Chris Younes and Isabel Herault
The façade on the street side is made up of several layers which reveal the building’s unusual design, and make a feature of it through the system of outdoor corridors and the individual storage “boxes” placed in front of each apartment: the image is created by usage. People enter their apartments via a private balcony. Located between the walkway and the building’s main structure are the storerooms and bathrooms, which alternate with empty spaces running the whole height of the building. The “storage units” are clad with different coloured corrugated steel sheet, which individualize the apartments and together create an expansive, dynamic and contrasted façade – an unpatented and lively composition.
This project is not the only one example of bike-friendly houses designed by Herault Arnod architectes.
’24 apartments house’ project is located on a new BIA to Green Island, an eclectic neighbourhood of Grenoble composed of villas, workshops and small buildings on the banks of the Isere. It meets the certification BBC with 40% renewable energy, according to the requirements of the specifications of the ZAC. The building was designed to allow residents to live in the city as a house, with a privileged relationship to the outside. The twenty four units are through and have a large terrace facing west continues. Ends of the apartments have a triple orientation. All are served by an outdoor walkway sheltered east side. The building is intended to facilitate the use of bicycles in everyday life: each unit has a storage room, protected by winks perforated (over 50% vacuum), in which residents can store several bikes. The elevator is generously proportioned to allow everyone to borrow his bike.
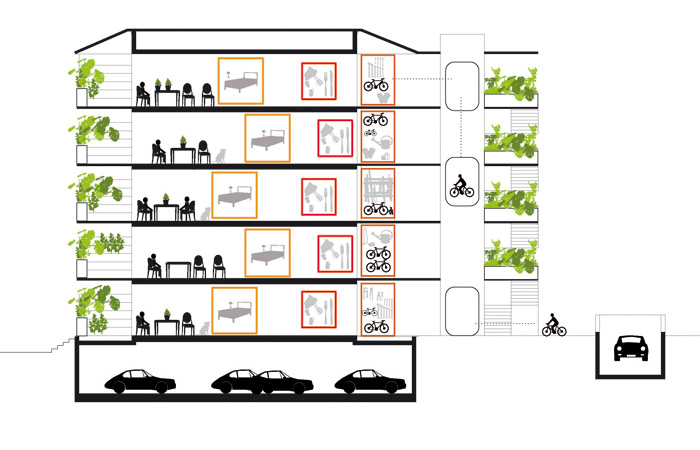
Image is made by Herault Arnod architectes | 24 APARTEMENTS |Grenoble 2011-2013
The building is very compact, its organization to optimize the stairwell and the elevator are grouped in a separate volume, which they are connected by a walkway. This volume is wrapped in open vegetation: a linear bins, equipped with an automatic watering, home to vines that invade gradually cables and nets stretched between floors.
The other example of bicycle friendly building is the EcoFlats mixed-use apartment building, along North Williams Avenue in Portland with its co-developer, Jean-Pierre Veillet of Siteworks Design Build.
Williams Avenue, once the heart of a thriving African American community, is today well known as a popular bike route as well as a burgeoning retail area of restaurants, cafes and shops.

Image is made by Jean-Pierre Veillet | the Eco-flats |
On the ground floor of the building, for example, is Hopworks Bike Bar.
“Some 3,000 riders a day pass by Mr. Ettinger’s new brewpub,” the New York Times’ Linda Baker writes of Hopworks in a recent feature about the neighborhood and catering to cyclists. “It has racks for 75 bicycles and free locks, to-go entries that fit in bicycle water-bottle cages, and dozens of handmade bicycle frames suspended over the bar areas.”
There are no automobile parking spaces for tenants, but the 18-unit building has storage for 30 bikes.
“Cyclists are a great potential market for businesses that want people traveling at human-scale speed and will stop and buy something,” Roger Geller, the city’s bicycle coordinator, also told Baker.
Eco Flats is one of 15 building projects aiming toward net-zero operations through a pilot program launched in 2009 by Energy Trust of Oregon. Co developed by Doug Shapiro, it was designed to use approximately 60 percent less energy than a building constructed to code stipulations. Veillet says actual savings have been higher, approaching 80 percent. In the ground-floor entry to the apartments via elevator, a flat-screen TV affixed to the upper wall conveys in real-time the amount of energy being used by each unit as well as how much energy is being generated by a rooftop array of solar panels.
If you decided to become bike user, but the house you live in is not bicycle friendly, try to make your home bicycle friendly by yourself. A bicycle doesn’t ask for much. It just needs a safe, dry spot away from thieves and vandals.
By the way, in a humorous note, there is also the opposite way: you can make your bike the main element and attach your house to it, as this man did for the Burning Man festival, or as seen in various creations involving a bike and a tiny home.
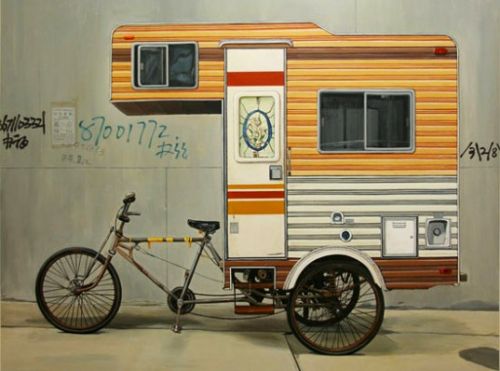
RV-Camper bike by Kevin Cyr
For further reading:
‘Bicycle friendly area’ – Design workshop at Auroville- PDF