
MapTube Homepage
Today I present the interview with Richard Milton, member of the research staff at the (CASA), a unit at the Bartlett Faculty of the Built Environment (The Bartlett).
CASA’s focus is to be at the forefront of what is one of the grand challenges of 21st Century science: to build a science of cities from a multidisciplinary base, drawing on cutting edge methods, and ideas in modeling, complexity, visualization and computation. Our current mix of architects, geographers, mathematicians, physicists, archeologists and computer scientists make CASA a unique department within UCL.
His current position in the centre is described as the following:
Richard is a Senior Research Associate currently working on the ESRC funded TALISMAN project, having previously worked on GeoVUE and GENeSIS. He is the key developer in these projects, being responsible for the e-infrastructure developed in GENeSIS and GeoVUE, which is currently used for real-time web-based geospatial data visualization. This infrastructure is currently used in the MapTube, SurveyMapper and Gemma websites.
MapTube is a free web resource for viewing, sharing, mixing and mashing maps online. The main principle of MapTube is that shared maps can be overlayed to compare data visually. For example, you can view a map of the London Underground overlayed with a map of building volumes to get a new perspective of the city.
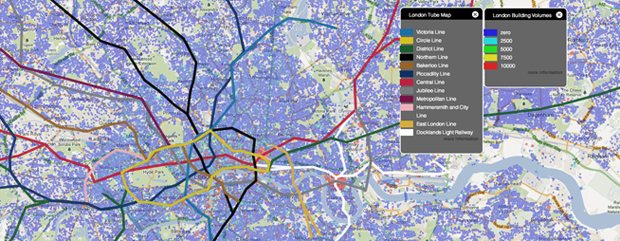
Overlay of London tube map and London building volumes
1. How did you get to the practice of mapping?
I originally got into mapping by working on weather visualization systems for the UK Meteorological Office. After that, I worked on a project in UCL on GPS-tracked carbon monoxide sensors, displaying the data through both 2D and 3D views of the city. Then, I started working for CASA, developing the GMapCreator software, allowing people to create Google Maps from the data stored in shapefiles, which led to the MapTube website.
2. In what way do you obtain and treat the data for your mapping?
I often have to do a lot of pre-processing of the data before it can be mapped, but on an ad-hoc basis. The real-time data is also quite challenging as there are often errors in the data that have to be cleaned and the pre-processing for the London Underground, National Rail, and Bus data are quite involved. The data is sampled on a 3 minute basis, so all processing needs to happen very quickly.

Global McDonald’s Big mac prices, 2007
3. What is the application of the open source mapping you are interested in the most?
I think the amount of data that’s now in the public domain is the greatest interest. We are getting to the point where we are being swamped with data and need to look for methods to handle much larger quantities than before.
4. What is the next phase of development your research is undergoing?
The next phase of development is very hard to quantify. We’re looking into various things like BigData, Real-time data and DataMining.
5. What are you personal references about the theme of mapping (from ancient to contemporary ones)?
My interests are really in automatic mapping, from data and how you handle it from multiple sources (data fusion) to visualizing complex situations.

England grade of land use
This is the last post (for now!) in our MetaMap series about mapping. You can follow the conversation in your favourite social network through the #metamap hashtag.

[…] Se puede encontrar la entrevista al respecto en el siguiente link: http://ecosistemaurbano.org/english/metamap-maptube-by-casa/ […]