Pablo de Soto is part of the generation who lived and experimented with the creative explosion generated by the web. His studies in architecture have enabled him to look at digital culture through a unique perspective. Keeping as reference, science fiction, situationism, and hacker ethic.
In 2001, he founded hackitectura.net, along with José Pérez de Lama and Sergio Moreno Páez, and a crew of architects, programmers, artists, and activists that participated in projects that dealt with themes of cartography and mapping. I interviewed Pablo de Soto about Sevilla Global, Cartografía Crítica del Estrecho de Gibraltar, and Mapping the Commons (Istanbul and Athens)
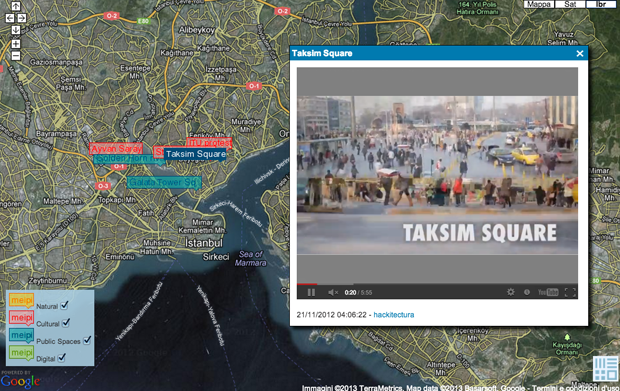
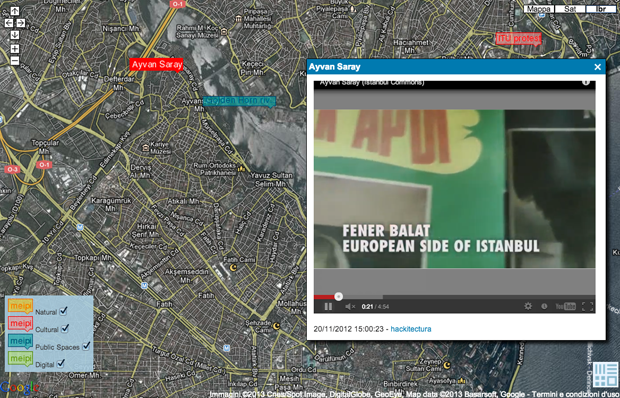
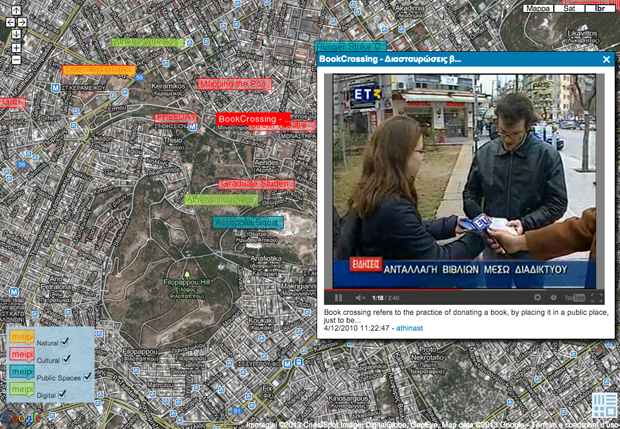
Here are a few screenshots of the maps:
Taksim Square, Istanbul
Fener Balat, Istanbul
Brook Crossing, Athens
This post is part of the MetaMap series about mapping. You can follow the conversation on your favourite social network through the #metamap hashtag.
How can urban design solve the complex situation that takes place in street junctions where bikes, pedestrians and motorists have to cross and turn in different directions? This interesting video shows one of the typical Dutch solutions to this problem.
Could this be implemented everywhere? While other places are going for mixed use of the street (like Spanish ciclocalles) or even more radical solutions like shared space or even ‘naked streets’ without any signs or lights, cities in the Netherlands are known for making extensive use of segregated bike lanes, and that is the scenario where this kind of solution makes sense. There are also other types of intersections, like the roundabouts, which can solve the same problem in a different way.
It’s worth noting how helpful the video format is for explaining this kind of dynamic issues in the city. I also recommend reading the discussions under the posts linked below; you will find interesting opinions and alternatives.
Cities, organizations increasingly vast and uncontrolled, crystallize today most social and environmental issues. Intensification is a hot topic as antidote to urban sprawl and overconsumption of the territory, but how to live in the dense city, make it livable and desirable? This paradox between individual aspirations and the need to contain the growth of cities is a challenge for the architecture, the opportunity to imagine new types of habitats, for the collective economy of the soil, but offer a sense of independence and freedom in the use of space, from within and without.
Let’s find a simple example: to reduce private car use, many cities are trying to promote green transport methods, including cycling, which is highly valued by the local population that exhibits a strong “scientific, sporty and green” image. The cycle path network is growing, but the problem lies at the two ends: What do you do with your bike when you get to your destination?
The bicycle is the most efficient form of transportation ever devised, and it delivers a whole-body workout. Cycling consumes far fewer calories per mile travelled than cars, buses, or even walking. It is sometimes the fastest way to get around a city. Cyclists can zip around traffic jams and don’t have to fight for a parking spot because they can bring the vehicle home… maybe: Many homes aren’t bicycle-friendly, so bikes are either not used or not purchased.
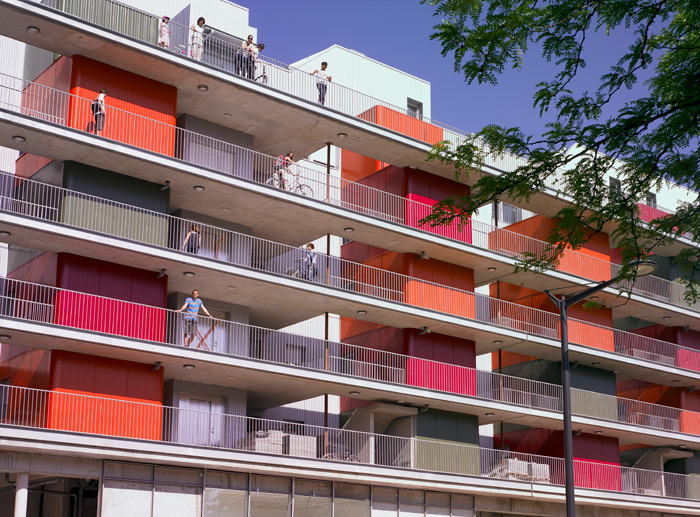
The French architectural studio ‘HERAULT ARNOD architectes’ was faced with that problem in Grenoble, where they designed a sustainable residential house.
Image is made by Herault Arnod architectes | L’IMMEUBLE À VÉLOS |Grenoble 2006-2010
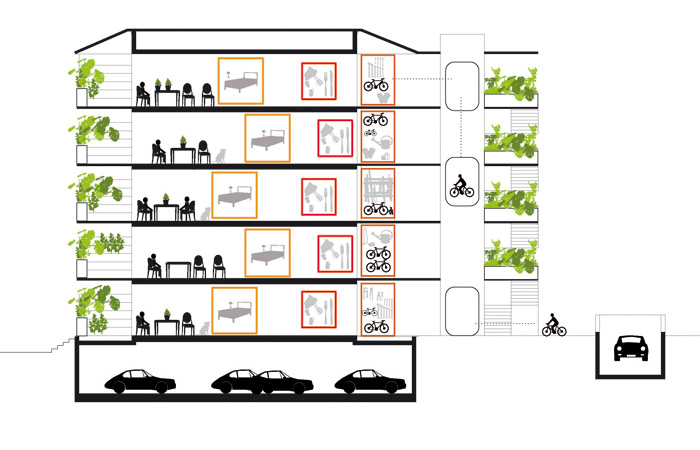
The project ‘Bike building’ has a system which makes possible to take one’s bike to the door of one’s apartment. The lifts are big enough to carry bikes; the corridors are wide and form a panoramic walkway with views over the mountains. People enter their homes as they would a house, from the outside. The architecture of the storage and distribution system is designed for a project situated at the end of the cycle path network. People will be able to reach their front doors on rollerblades, scooters, bicycles, etc., and then store their wheels in a safe place.
‘…This project was conducted as part of an order placed by the architects to 8 City of Architecture and Heritage, on the theme of a “Habitat densified environmentally responsible.” These projects were gathered in one part of the traveling exhibition “Living Green”, which was provided by the police Gauzin-Dominique Müller, and which was presented to the City of Architecture…’ say Chris Younes and Isabel Herault
Since the outskirts of Grenoble are layered with districts of detached houses which generate traffic flows that grow more intense and more extensive each day, it is time to think about urban housing that is more in tune with contemporary aspirations. What does a detached house have that an apartment does not? Amongst other characteristics, we identified the relationship with the exterior, which is more direct and special, the greater privacy, and storage capacity: according to a recent study, 40% of the surface area in detached houses is used to store various objects, food, clothes, tools, bicycles, windsurfers, skis, etc.
‘…>80% of the population would rather live in a detached house than in an apartment block in town. What does a detached house have that an apartment does not? Amongst other characteristics, we identified the relationship with the exterior, which is more direct and special, the greater privacy, and storage capacity: according to a recent study, 40% of the surface area in detached houses is used to store various objects, food, clothes, tools, bicycles, windsurfers, skis, etc….’ say Chris Younes and Isabel Herault
The façade on the street side is made up of several layers which reveal the building’s unusual design, and make a feature of it through the system of outdoor corridors and the individual storage “boxes” placed in front of each apartment: the image is created by usage. People enter their apartments via a private balcony. Located between the walkway and the building’s main structure are the storerooms and bathrooms, which alternate with empty spaces running the whole height of the building. The “storage units” are clad with different coloured corrugated steel sheet, which individualize the apartments and together create an expansive, dynamic and contrasted façade – an unpatented and lively composition.
This project is not the only one example of bike-friendly houses designed by Herault Arnod architectes.
’24 apartments house’ project is located on a new BIA to Green Island, an eclectic neighbourhood of Grenoble composed of villas, workshops and small buildings on the banks of the Isere. It meets the certification BBC with 40% renewable energy, according to the requirements of the specifications of the ZAC. The building was designed to allow residents to live in the city as a house, with a privileged relationship to the outside. The twenty four units are through and have a large terrace facing west continues. Ends of the apartments have a triple orientation. All are served by an outdoor walkway sheltered east side. The building is intended to facilitate the use of bicycles in everyday life: each unit has a storage room, protected by winks perforated (over 50% vacuum), in which residents can store several bikes. The elevator is generously proportioned to allow everyone to borrow his bike.
Image is made by Herault Arnod architectes | 24 APARTEMENTS |Grenoble 2011-2013
The building is very compact, its organization to optimize the stairwell and the elevator are grouped in a separate volume, which they are connected by a walkway. This volume is wrapped in open vegetation: a linear bins, equipped with an automatic watering, home to vines that invade gradually cables and nets stretched between floors.
The other example of bicycle friendly building is the EcoFlats mixed-use apartment building, along North Williams Avenue in Portland with its co-developer, Jean-Pierre Veillet of Siteworks Design Build.
Williams Avenue, once the heart of a thriving African American community, is today well known as a popular bike route as well as a burgeoning retail area of restaurants, cafes and shops.
Image is made by Jean-Pierre Veillet | the Eco-flats |
On the ground floor of the building, for example, is Hopworks Bike Bar.
“Some 3,000 riders a day pass by Mr. Ettinger’s new brewpub,” the New York Times’ Linda Baker writes of Hopworks in a recent feature about the neighborhood and catering to cyclists. “It has racks for 75 bicycles and free locks, to-go entries that fit in bicycle water-bottle cages, and dozens of handmade bicycle frames suspended over the bar areas.”
There are no automobile parking spaces for tenants, but the 18-unit building has storage for 30 bikes.
“Cyclists are a great potential market for businesses that want people traveling at human-scale speed and will stop and buy something,” Roger Geller, the city’s bicycle coordinator, also told Baker.
Eco Flats is one of 15 building projects aiming toward net-zero operations through a pilot program launched in 2009 by Energy Trust of Oregon. Co developed by Doug Shapiro, it was designed to use approximately 60 percent less energy than a building constructed to code stipulations. Veillet says actual savings have been higher, approaching 80 percent. In the ground-floor entry to the apartments via elevator, a flat-screen TV affixed to the upper wall conveys in real-time the amount of energy being used by each unit as well as how much energy is being generated by a rooftop array of solar panels.
If you decided to become bike user, but the house you live in is not bicycle friendly, try to make your home bicycle friendly by yourself. A bicycle doesn’t ask for much. It just needs a safe, dry spot away from thieves and vandals.
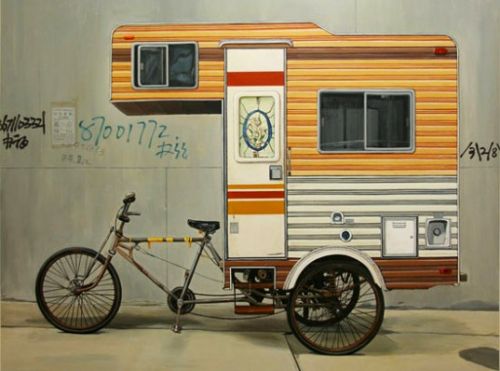
By the way, in a humorous note, there is also the opposite way: you can make your bike the main element and attach your house to it, as this man did for the Burning Man festival, or as seen in variouscreations involving a bike and a tiny home.
RV-Camper bike by Kevin Cyr
For further reading:
‘Bicycle friendly area’ – Design workshop at Auroville- PDF
Basurama is a forum for discussion and reflection on trash, waste, and reuse in all its formats and possible meanings. It was born in the Madrid School of Architecture (ETSAM) in 2001, and since then, has evolved and acquired new shapes.
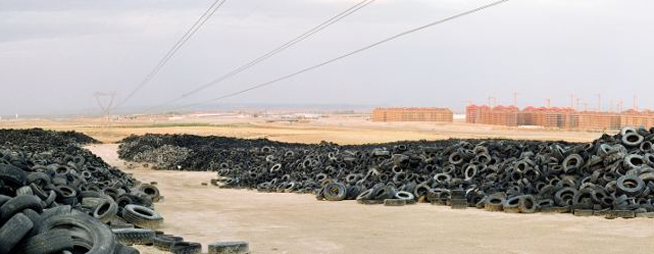
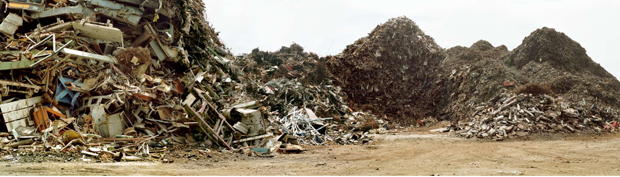
Tire Cemetery in Seseña (Toledo)
I interviewed Pablo Rey Mazón, member of Basurama, about 6000km, a project about the concept of trash applied to new constructions and land use, the metabolism of the city.
1. How did you get to the practice of mapping? What led you to the practice of mapping?
We use mapping, a geo-spatial representation of things, to understand and display complex situations. Maps have always been interesting to me: subway maps, the Callejero (the streetmap book from Madrid), and later in architecture school, I was using and producing maps quite often. Google Maps and Google Earth came later…. maps are one special part of all the data visualizations tools available.
I have also participated in the development of meipi.org, an open source software for collective geo-location of information (texts, photos, videos, and audio) online, that we have used in many projects.
Interface of the map – Click to see original at Meipi
2. How did you choose the object of your mapping?
A map is a tool to decode certain information. Depending on the project, we would use one visualization or another. When we’re interested in the location of things, we use maps. In Basurama, we’ve used maps for many different projects apart from 6000km:
-Mapping urban metabolism landscapes (panorama photos) + real estate bubble: map, tactics in 6000km
In Ruhr, we used geo-located photos that we took, and a special instance of Meipi, to show the location of possible reusable waste. In spermola.org, we tried to give the opportunity to exchange an object by providing information about where the object was.
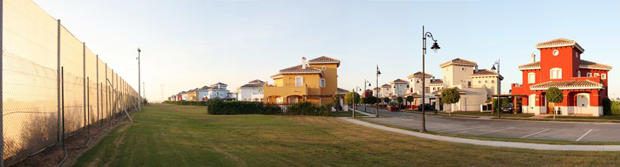
6000km started as an exhibition of 10 big format panorama photos from the Madrid outskirts: landfills, highways, scrapyards, and abandoned places. The project was part of the exhibition and was named Basurama Panorámica. It shows the public different places to envision the consequences of the urban expansion that was occurring at the time. Each photo had a short text attached to it, that served to contextualize and give basic information about it. We didn’t just want ‘awesome’ photos, we wanted to make people understand where and what those locations were. The exhibition had two related maps: urban growth and highways, apart from a location map of all the photographs. Displaying urban developments together with landfills and empty toll highways was the way to show the relation among all the urban metabolism related situations. Empty buildings made for speculation purposes where as waste made for scrapyards. That was 2006, 2 years before Lehman Brothers declared bankruptcy.
Later on, when we addressed this project in a country scale we studied and mapped all the situations in 6000km.org. “6.000 km” were the kilometers of highway that the government was planning to build until 2020.
Mar Menor Golf Resort – Torre Pacheco, Murcia
3. In which way do you want this work to affect the people and society?
It is difficult to say how a particular project modifies the perception of a situation. In 2006 the real estate bubble was about to burst, but the public perception was saying “prices are never going to drop”, “we are the biggest growing economy in the world”, “keep building, buying, and selling, make money”. Mass media and politicians were basically denying the real estate bubble or saying that the process of land destruction was not sustainable. It was uncommon to address this topic. Nowadays, we can watch and read multiple news, documentaries, and exhibitions about a contemporary ruin or the economic crisis, but that was not the case back in 2006. It is impossible to measure that impact.
4. Which is the next phase of growth/development your research is undergoing?
We went from the regional scale, Madrid conurbation, to a country scale, Spain, in 6.000km. We created an online map at meipi.org/6000km to display how our research evolved and to open both the information and participation to the public. We went to many of those places to document the sites. We have a full list available of all the studied locations, as we have realized before in Meipi, that maps are not the only way to show spatial information, and that lists can also be very useful.
Global scale: Since we’ve been travelling often to America with Basurama in the last years, we are now exploring ways to talk about these situations on a global scale in PAN AM, Panorama Americana.
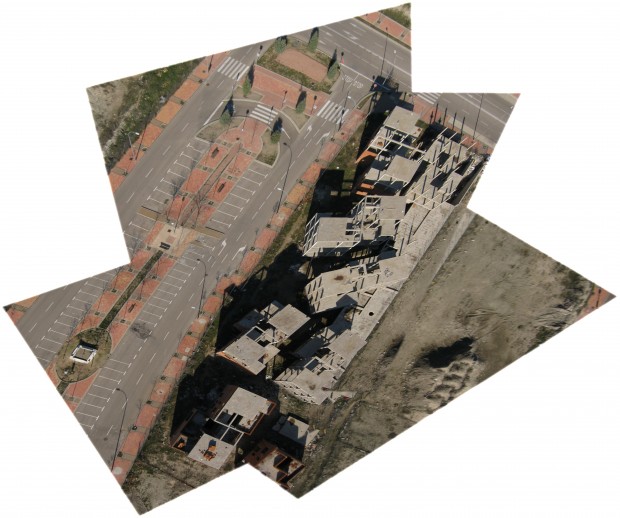
Ruins in Vallecas, Madrid – Click to view original map
Photos from the sky: We are also exploring new ways of exploring the territory with cheap balloon mapping technology. Our first results from Spain could be seen in the ruins at PAU del ensanche de Vallecas. Since last year we’ve been collaborating with the Public Laboratory in Boston, where we are mapping the evolution of an ash landfill in the suburbs of the city, Incinerator Landfill in Saugus, MA, USA, as well as mapping the waste locations from Cambridge, MA.
Civic maps: I am involved in a tool kit about civic mapping that will be released this year by the Center for Civic Media.
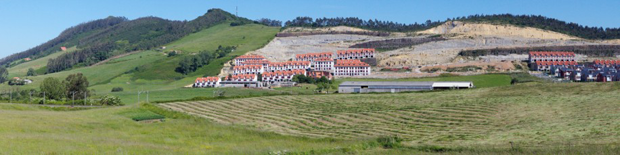
Alto del Cuco – Pielagos, Cantabria
5. What are your personal references for the theme of mapping (from ancient to contemporary ones)?
References come from many places: data visualization researchers like Edward Tufte; open hardware and cheap tools by Public Laboratory; Ushahidi and Crowdmap for collective info about maps; vojo.co for collective reporting from cheap phones; and online cartography tools like OpenStreetMap, where we are contributors and try to draw landfills and other non represented places in the map.
All the photos of the article are under a Creative Commons Attribution 3.0 Unported License and are made by Rubén Lorenzo Montero and Pablo Rey Mazón (Basurama). See legal notice.
Marielyst is a small town in the south of Denmark well known for being one of the most popular holiday locations on the Baltic Sea. Since the beginning of XX century its 20 km of white sand beaches attracted an increasing number of seasonal tourists, up to host nowadays 6000 summer houses in its area. The spatial configuration of Marielyst appears chaotic and it’s lacking of a recognisable identity; the main element of the urban structure is the principal street, a traffic vein that allows people to reach the heart of the small town, and from which secondary narrow streets start connecting every single wooden house. The subject of Marielyst competition was finding and providing a spatial organization to this place in order to structure an urban articulation among its parts. Moreover, an important feature to be considered in this site’s revitalization was the “beachy” atmosphere of Marielyst, its main character.
As usual, we worked with a multidisciplinary and international team, with the Danish landscape Office Kristine Jensen, after being chosen among 4 other finalists.
Plan
Our proposition started from the identification of the land’s shape, which changed its configuration many times until the present. In the past, the island of Falster -where Marielyst is located- was composed by three smaller islands and was crossed by water; the area had been also flooded and remained swampy for many years, until the late 1800, when it was drained. Inspired by this ancient situation, we conceived the idea of “Delta“, a sinuous and porous path that connects the dynamic activities of urban space with the relaxed atmosphere of a beach context.
Summer time
The landscape project focuses on the valorization of the great quality of the natural elements that characterize the site -pines, sea, sand dunes, dike, grass- making them stand out very clearly. The concept of “Delta” appears with the intention of spreading many accesses to these natural landmarks, connecting them through physical and conceptual paths. The Delta structure allows to pull the beach ambience in the urban space, both melted in a fluid unity; the achievement of this atmosphere is possible by choosing very soft and discreet materials to create paths and furniture elements, by substituting the current asphalt with tracks, marks and signs that simplify integration between the two ‘souls’ of the place.
Witer time
We elaborated one of the main aspects of Marielyst STRAND proposition, the activity plan. “Let it be fun!” is the motto we’ve chosen to summarize our idea to regenerate this area, being certain that the requalification of an urban space could not disregard the involvement of people in making the place alive.
The activity plan during daytime
Activity plan for the night
We’ve developed a series of entertaining and bizarre urban objects and we have settled them in the Marielyst area in order to provide several activities aimed to reinvigorate the site during summer as well as winter time. We have tried to get inspired by the surrounding environment to elaborate ideas that allow people to appreciate the visible and the invisible natural local elements.
Catalogue
Our proposition for Marielyst urban contest mainly consisted in designing urban objects strictly connected with natural elements that characterize the site, like rich vegetation, long beaches, fresh water and strong wind. The objective of our urban design strategy for Marielyst was to transform this ordinary beach on the Danish coast in a unique and very attractive site that could easily become a reference point for people who want to spend funny holidays in sustainable way.
Catalogue
The catalogue includes elements to enjoy the view of landscape from above (the watching tower, the balloon in the sky); elements integrated in the vegetation that allow to take advantage of its amenity in an unconventional way (the hammocks, the spider net, the hanging chairs, the fireplace); objects that transform the beach in a big playground (the playful tower, the oversized playground); objects that use wind to catch its power and transform it into energy (the windmill lamp) or just exploit its strength to create ephemeral landmarks (the wind fish, the wind parade).
Catalogue
Other elements are mobile and contribute to constantly change the configuration of the place, like the rolling cabins -temporary supports for sport activities or refreshment bars-, or the vehicles on wheels, a kind of elaborated bikes that could be used to move along the city and create temporary stages, movable slides, or on the road benches. Moreover a big attention is given to the socializing areas, as the rooftop terrace of an existing building along the main street, the picnic area or the water cloud, a playful object very useful to refresh atmosphere during sunny days of Baltic summer.
[im]possible living is a crowd-sourcing website dedicated to mapping and reactivating abandoned buildings around the world.
[im]possible living wants to be an enabler and a catalyst of the energies available in every place in the world that are not able to get through and give birth due to the abandonment market and, in general, to a new housing development model. It’s a very ambitious goal, but we truly believe in it and are investing everything in this dream!
I interviewed the two founders, Daniela Galvani and Andrea Sesta, about the project.
1. How did you get to the practice of mapping?
[im]possible living is born from our personal interest in abandoned buildings. At the time we understood that many individuals and associations were spreading energies to map the abandoned buildings in their area, but everyone was doing their own maps, thus losing the possibility of sharing results, experiences, and the best possible practices.
So we decided to create a global map of abandoned buildings via a web platform, where everyone could participate and contribute to a common goal and benefit from the experiences of other people.
Since the beginning of the project we have gone far beyond mapping tools. With the last release of our site, people can now reactivate an abandoned building and involve the community in the design concept for the new life of the building.
2. How is the users’ contribution managed? How does the platform work?
The website consists of a service through which users can surf and see the abandoned buildings that have been mapped around the world, which also shows their profile, containing a general description and some detailed information about the building (year of construction, years of abandonment, square meters, number of floors, etc.) To explore the mapped buildings click here.
The real heart of the service, however, is the reporting and collaboration features, through which users can upload new abandoned buildings and enrich existing records by adding photos and videos. If you would like to begin a map click here.
Users can also use a mobile app for the iPhone to instantly map abandoned buildings. Once launched, the application allows you to choose a photo from the Pictures archive, add essential information and automatically provide the geographic data associated with the location (street, city, etc.), allowing the user to change any incorrect information.
The last new part, which has launched recently, allows users to start a reactivation process. Once an abandoned building is mapped, a user can decide to become the reactivator of the place and [im]possible living provides him/her with a suit of services that helps collect the needs of the area, ideas for the future of the building, and in general, create a community that supports the reactivator in designing a concept for the new life of the building. The platform also tries to connect different kinds of users, everyone possibly involved in the renovation process: citizens, entrepreneurs, professionals, artists, real estate developers, etc.
[im]possible living map
These services are now online and we already have some projects running that you can contribute to or simply surf to get an idea:
3. What is the process you wanted to start with your work? What is the social aim youwanted to reach with your work?
In the last years we have witnessed the constant investment in new construction, leaving behind millions of old abandoned buildings. This process has led to the phenomenon of land consumption in most of the world, but the recent economic crisis stressed the problem even more, condemning the new constructions to remain vacant.
The solution to this problem is taking an altogether new approach: abandoned buildings are not liabilities but assets from which we should take the most possible advantage. [im]possible living tries to promote this new sustainability approach. Instead of building new structures over and over again, we can utilize what already exists. Having abandoned buildings in your city or in your neighborhoods is not only a waste, but it also means trouble, that, in a long term perspective, becomes costly for the public sector.
We are creating a platform available to all, which consists of the most complete database of abandoned buildings in the world. It is a virtual place that everyone can use and all can be shared and discussed, and where citizens can actually have an influence in shaping the future of the place they live in.
Many times the interests of construction companies, or even publicadministrations, are not consistent with the local environment of the area itself. This missing link between those sides can be discussed through the [im]possible living platform, in order to build mutual benefits for both sides. Through the website, entire communities can share their needs and ideas, and this could lead to a win-win situation for all parties involved.
Nowadays, real estate projects are handled behind closed doors and the problem is that often the local population is not involved in the design process. This implies, on the one hand, a mismatch between the purpose of the construction project and the real needs of the urban and social settlement. On the other hand, it takes additional time to complete due to the resistance from local communities, which often brings in legal involvement.
Our aim is to create a more efficient process to reuse abandoned structures, with a benefit for local communities that will be able to affect or even contribute projects on the online platform. A benefit for the public and private investors that would receive important inputs or even entire concepts developed by teams of reactivators and a benefit for the reactivator teams that would pursue their own projects with all the technological, professional, and financial support to fully accomplish their goal.
4. What is the next phase of development that your research will undergo?
We released the reactivation services a few months ago, so now our aim is to expand the community as much as possible and start as many reactivation projects as possible. This is very connected to making the available services better, making the actions easier, making the contributions from the community as simple as possible, and adding new features that can increase the sharing activity on the site.
Furthermore, we want to investigate the real bottleneck of reactivation processes: getting the project funded! In fact, the real problem when you talk about abandoned buildings is that, even with low-cost interventions, using them involves pricey investments. So our question is: How do we ease the investment process? How can we push for better projects and actually bring them to life? It’s complicated research, but it’s definitely what we want to focus on during the next year.
5. What are you personal references for the theme of mapping (from ancient to contemporary ones)?
Our point of view is very connected to recent technologies, in particular, web technologies. We consider the birth of web 2.0 and web 3.0 the beginning of a new era: the shift from static contents to dynamic ones, but more importantly, the participation and involvement of people in crowd projects, tools created for geo-localization, augmented reality, and much more.
This had a dramatic impact on the theme of mapping: for the first time in history, people from around the world could contribute to global mapping projects seamlessly, using services like Google Maps, Open Street Map, Wikimapia, History Pin, Ushaidi, Foursquare, and thousands of other services that are enabling users to map things in the world and share the information globally.
This process is generating a huge amount of data that, in most cases, is openly available to everyone via API systems (in computer science, an API is a way to access private databases, retrieve information, and build a new service using one or many different external data sources) For example, today I can use Google Maps API to obtain geographical information and then use Wikipedia to map monuments and historical places.
The potential of this revolution is very immense and has already started to affect our society in a significant way, but we still can’t entirely understand all the possibilities that will be generated in the upcoming decades.
Accurat is an information design agency based in Milan and New York, founded by Giorgia Lupi, Simone Quadri and Gabriele Rossi in 2011.
They define their work as the following:
We envision and identify new ways to structure information, revealing and addressing latent needs, desires and opportunities. Basing our methods on the design thinking approach, we specialize in providing our clients with consultancies, services, and products related to information design. Focusing on how information is transforming networks, cultures, contexts, and behaviors is an attempt to understand the future, a demonstration that it can be intercepted and designed.
I interviewed them about Big Data base maps and about their ongoing work in mapping: ✳Urban Sensing.
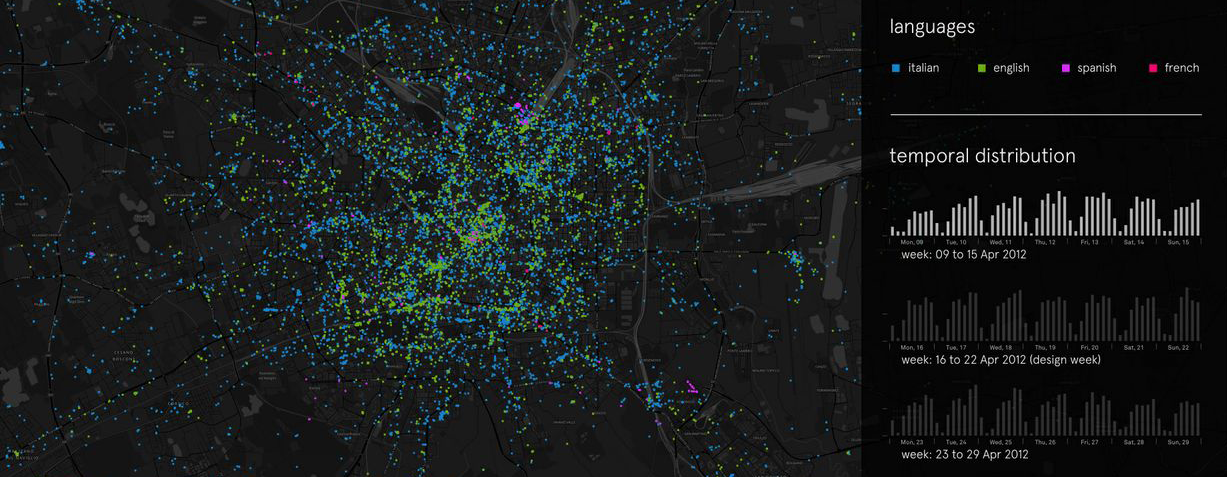
Experiment of Tweet mapping in Milan during design week
1. How did you get to the practice of mapping?
To us, mapping could be seen in a broader context as “structuring information”.
To start off, it’s not needed to say that information related issues are at the core of any design project that deal with cities, public services, society, and behaviors regardless of scale. Particularly, we have always been interested in urbanrelated projects that deeply rely on information: contexts, analyzing data, designing analytical tools, and visual narratives that provide awareness and comprehension of changing urban dynamics.
In our past entrepreneurial experiences, at Interactiondesign-Lab, we experimented working between the intersection of information systems and urban dynamics within the design of the Plan of Services for the Municipality of Milan (developed between 2009 and 2010). We designed a plan not to be intended as a product or document, since it was developed as a continuous process of listening, monitoring, reporting, and crossing the needs and the offers in terms of services of the city.
We designed 2 tools at 2 different scales, the macro scale of the city and the micro scale of the neighborhood. These tools don’t define what services we plan to have, but they give directions on how to cross the demand and the possible answer in terms of services in a meaningful way. It was, in fact, an information design project.
2. In what way do you obtain and treat the data for your mapping?
A big mapping project we are currently working on and coordinating at Accurat is ✳UrbanSensing.
The ✳UrbanSensing project is a EU funded project which aims to design and develop a platform for extracting patterns of use and citizens’ concerns with city spaces, through robust analysis of User Generated Content (UGC) shared by city users over social networks and digital media. The platform will allow the user to analyze citizen’s perceptions related to specific geographic areas and understand how population reacts to new urban policies within participatory mechanisms.
Novel digital and telecommunication technologies can be deployed to integrate data-sharing platforms within the spatial dynamics of the city. If properly analyzed, geo-tagged and User Generated Content (UGC) coming from Twitter, Facebook, Foursquare, or Flickr can be useful in the creation of meaningful, real time indicators of people’s perceived and communicated urban experiences. Through natural language and network analysis, it is possible to identify the nested micro-narratives that shape the behavioral and semantic background of a place and to extract specific urban indicators.
Our assumption is that by conducting an analysis of datasets based on text extracted from UGC we can recognize multiple stories, as they emerge, overlap and influence each other, unfolding from city users’ mental representations and spatial experiences of city spaces. In fact, by providing tangible, visible references, the spaces of actual buildings and cities participate in constructing the meaning of the speech that articulates itself within them and as conversations unfold within particular architectural settings, they build up increasingly dense webs of shared understanding grounded -at least in part- on the points of reference that these settings afford.
Thus, within ✳UrbanSensing we are mainly gathering and analyzing geo-localized social media data (Twitter, Foursquare, Instagram, and Flickr); and such data will be properly integrated and compared with more traditional sources of urban information (socio-demographic territorial data, real-estate indicators, and environmental data) to produce dynamic and evolving images of the city as used and perceived by its’ citizens and temporary users.
3. What is the application of open source/social network-based mapping you are interested in the most?
If properly analyzed, integrated, and interpreted, Social Media data can help stakeholders at the urban scale to “forward-looking” innovation strategies based on a thorough analysis of people’s contexts, interests, and needs.
Among the possible urban topics this data could partially answer to, we will narrow them to the following particular issues:
Rapidly intercepting emerging urban dynamics, such as gentrification processes and precise areas’ evolution through time (for identifying trends in areas’ related phenomena, in the exact moments they’re originated, with the possibility to add more dynamic parameters to those used by the real estate market);
Understanding which are the factors (e.g. morphological aspect, aesthetic quality, public service availability and density, infrastructure granularity, cultural scene, and commercial service) that attract people in particular places (areas, neighborhoods), and how this evolves through time;
Understanding which kind of people (language / on-line influence / demographics) are in specific areas at particular moments;
Highlighting patterns of movement throughout the city (from which places people in an area come from? where are they going? are they residents, visitors, or ordinary city users?);
Interrogating data about a particular topic (e.g. brand name, event name) or about a selected theme (e.g. cultural phenomena, cutting-edge topics) to see how things evolve spatially and temporarily.
All this, to provide a better understanding of an areas’ related phenomena and evolution, to redefine actual districts’ fixed boundaries and to see where public services, policy’s infrastructures, design interventions, or activities could be better located, and to try and build models to predict near-future evolution;
Experiment of Tweet mapping in New York
4. What is the next phase of development that your research is undergoing?
One of the forthcoming steps of our project is to gain a deeper understanding of:
How such data sources could be interpreted (in terms of sharing behaviors and motivations) to get actual and consistent insights;
Which are the real limits of such data in terms of research (e.g. demographic, digital divide, economic, location-related);
How to overlap and integrate such data sources with more traditional layers of territorial information (e.g. socio-demographic data, income data, rental costs, ethnic data, and environmental ones such as pollution and sanitary inspections, etc.) to finally display extreme high-resolution views and interpretations of territorial related dynamics.
How unexpected patterns and meaningful questions could emerge from data themselves.
In fact, UGC differs from conventionally produced geographic information in several aspects. The source of the information, the technologies for acquiring it, the methods and techniques for working with it, and the social processes that mediate its creation and impact. Traditionally, geographic information has been produced by experts and institutions, therefore, certain types of information have been privileged and other types ignored, and even marginalized. UGC’s represent a powerful shift in sources, content, characteristics, modes of data production, mining, sharing, dissemination, and use. Therefore, a wide set of meaningful questions (that have been partly investigated for “conventional” geographical information) need now to be re-investigated, and a framework on how to use these information still has to be built.
In parallel, we are designing and developing the technological architecture and the actual interface allowing us (and lately, stakeholders) to perform specific queries and produce such dynamic maps in a very visual and intuitive way.
5. What are you personal references for the theme of mapping (from ancient to contemporary ones)?
We would here focus on emerging critical practices that propose new models to describe the city that stresses the collaborative and constructionist dynamics of the mapping process.
The underlying idea of this approach considers the geographic, urban experience through a network of multiple fragmented temporary data and information generated by human-place interactions and collaborative dynamics. Based on these theoretical premises, several experimental GIS-based applications focusing on cartography emerging from users’ perceptions and activities have been produced.
As Zook & Graham noticed, traditional methods used to register users’ perceptions and activities about the cities and its fruition – like surveys and ethnographic reports – seem to be inadequate to meet the need of information of contemporary society both because they require a considerable amount of resources (in terms of time and money) and because they do not consider the temporal dimension.
Senseable City Lab explored mapping systems based on UGC on several projects like World’s Eyes and Obama One People.
Current City, a European foundation committed to address long-standing city management problems in unconventional ways, explored the potential of urban mapping based on real-time data streams on users’ location coming from telco providers.
Christian Nold’s work focused on in-depth research of technological tools in order to unravel their social and political layers, and on building socially constructive, bottom-up devices, that take the form of practical tools such as in the Bio Mapping project.
Bio Mapping is a research project based on biometric sensors that can be worn by users provided with a GPS device able to trace their paths through the city, and that register specific parameters (e.g. emotional status in a specific place or situation) and publish them as user generated content on specific emotional maps. This project explores tools that allow people to selectively share and interpret their own bio data. Within this framework, Nold investigates how the perceptions of a community in an environment can change when they become aware of their own intimate emotional status.
Some other recent GIS projects focused on the idea of building open tool-kits that could be used by the community of students and practitioners of urban design, planning, and management. The Centre for Advanced Spatial Analysis at UCL created MapTube as a free resource for viewing, sharing, mixing, and mashing maps online and the NeISS project (National e-Infrastructure for Social Simulation) provides a platform to meet the demand for powerful simulation tools by social scientists and public and private sector policymakers. The tools enable researchers to create workflows to run their own simulations, visualize and analyse results, and publish them for future discovery, sharing, and re-use. This facilitates development and sharing of social simulation resources within the urban planners and social science community, encourages cooperation between model developers and researchers, and helps foster adoption of simulation as a research method and as a decision support tool in the public and private sectors. Design Tool is an application proposed by Predrag Šiđani, which has its starting point in Lynch’s propositions about city and urban form. Lynch’s theory of urban form and its hierarchical structure of main urban elements were applied, together with his concept of cognitive mapping, to a conceptual model of the Design Tool.
This is the second post in the MetaMap series about mapping. You can follow the conversation on Twitter, Google+, Diaspora, or Facebook through the #metamap hashtag.
credits: Giorgia Lupi and Gabriele Rossi (accurat.it) acknowledgements: texts above are part of the ✳UrbanSensing project
Design Week Tweets: Accurat with Marco Vettorello (data gathering) and Paolo Patelli (data processing and visualization)
Thanksgiving: Accurat with Marco Vettorello (data gathering and processing)
Maps and cartography have been, traditionally, tools to express and exercise power and have been used exclusively by a few people who held the knowledge. Nowadays, this practice is enriched by more and more nuances and gets contributions from all sorts of fields.
We find maps exposed in galleries, painted in the streets, and drawn as acts of performance art, dealing with the necessity to express identities and culture in mass societies. We see maps based on a huge amount of information and realtime data coming from social networks, which were only made possible once computer science and the web appeared, thus enabling us to have an unprecedented knowledge of what’s happening in cities. Cartography is even used as a tool to emphasize critical aspects of our society that, otherwise, wouldn’t be noticed and as a platform to solve these same problems.
All of these multiple approaches are becoming a common experience as they are often the result of a participative process and are shared as open source information. On one side, this shows the need of understanding the growing complexity of reality and the quantity of information that is being produced. On the other side, it expresses the need to re-create an identity through self-knowledge in the actual context of globalization.
I have decided to examine the current state of cartography due to the influence it’s having on many fields today, with the power to be transversal with the classical arts. This research is an ideal continuity with the exhibition that was recently hosted by Caixa Forum (Madrid), on contemporary cartographies. The exhibition started with the situationist and surrealist approaches that opened up the mapping discipline, introducing contaminations from other fields (art, politics, statistic…) overcoming the scientific point of view, showing it lacks the description of reality.
The aim of my investigation is to make a MetaMap, a research on different types of maps I come across, in this meta-map we will see the multiplicity of possible outputs, as well as the common points between them. Taking advantage of the web and its horizontal-knowledge rather than the classical vertical and deepened knowledge. The research was made seeking projects and asking the same set of questions to the authors. These interviews should make it possible to separate the different tendencies and intentions of mapping, tracing connections, and intersections. I manage to focus on particular authors by interviewing them to better explain their work.
This is the list of posts published in this series so far:
The posts in this series by our collaborator, Tommaso Miti, were be published once a week under the MetaMap category. You can follow the conversation in your favourite social network through the #metamap hashtag.
Next Thursday June 20th registration will be closed for the International Summer School, in which more than 20 teachers and 40 students will develop new forms of architecture, particularly related to tourism, in the valley of Solanas and in the coastal area in the south-eastern part of Sardinia.
Save the dates: July 3rd – July 13th
Special deal for European students: 50 € fee + 100 € for 10 days lodging
Learn more about this experience: coastal-landscape-architectures.blogspot.it
Starting July 3rd, Jose Luis Vallejo and Belinda Tato from ecosistema urbano will be joining more than 20 teachers and 40 studens in an International Summer School organized in the valley of Solanas (Sardinia) by Department of Architecture, Design and Urban Planning at the University of Sassari in collaboration with the Municipality of Sinnai.
The objective of the Summer school is to develop new forms of architecture, particularly related to tourism, in the valley of Solanas and in the coastal area in the south-eastern part of Sardinia. The development of new forms of architecture in coastal areas requires alternative approaches to the traditional scenarios of seasonal tourism. Teachers, students and public servants will be working together to face challenges related to the economically instable and unfavourable conditions created by seasonal tourism. The environmental contexts studied are sensitive and fragile, yet, at the same time, they are sites of great potential for developing innovative solutions and new uses. The activities of the workshop will aim at enhancing this potential by using the specific qualities and resources of the various contexts presented in the area.
If you are studying in Europe, you will get a special deal: Students coming from European universities only have to pay 50 euros for fee + 100 euros for 10 days for lodging + travel (there are cheap low cost flights to Cagliari).
And you’ll get to spend those 10 days learning, collaborating, walking and bathing in front of this great landscape… so don’t think for too long, registration is closing in 10 days!
Important information:
Registration is closing on June 15th! Edit: June 20th.
Save the dates: July 3rd – July 13th
Cost for European students: 50 € fee + 100 € for 10 days lodging
Learn more about this experience: coastal-landscape-architectures.blogspot.it


![[im]possible living](https://ecosistemaurbano.org/wp-content/uploads/impossibleliving02.png "[im]possible living")
![[im]possible living map](https://ecosistemaurbano.org/wp-content/uploads/impossibleliving01.png "[im]possible living map")